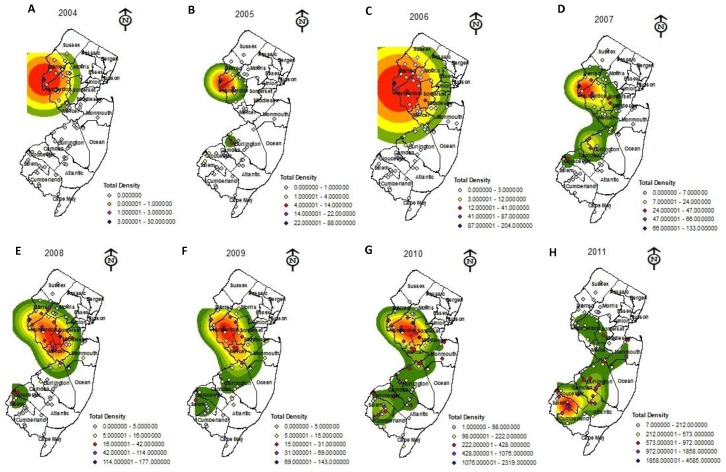
Figure 2. Kernel Density Estimation (KDE) graphs of the density of Halymorpha halys captured from black light traps placed throughout New Jersey from (A) 2004, (B) 2005, (C) 2006, (D) 2007, (E) 2008, (F) 2009, (G) 2010, (H) 2011.
KDE are based on actual and predicted density of H. halys where green reflects lowest population density, orange moderate to high population density, and red predicts highest population of H. halys. Total density of H. halys’ for year black lights were monitored is also provided.

