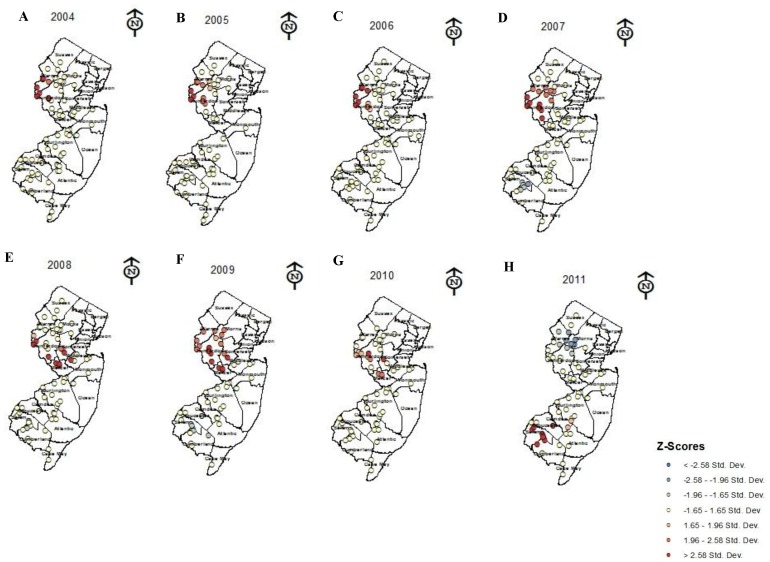
Figure 3. Hot-spot/cold-spot analysis graphs of the densities of Halyomorpha halys captured from black light traps placed throughout New Jersey from (A) 2004, (B) 2005, (C) 2006, (D) 2007, (E) 2008, (F) 2009, (G) 2010, (H) 2011.
Z-scores are standard deviations, associated with p-values found in tails of the normal distribution, with red and orange reflecting high density of H. halys that are significantly clustering with one another and light to dark blue reflecting low densities of H. halys that are significantly clustering with one another.

