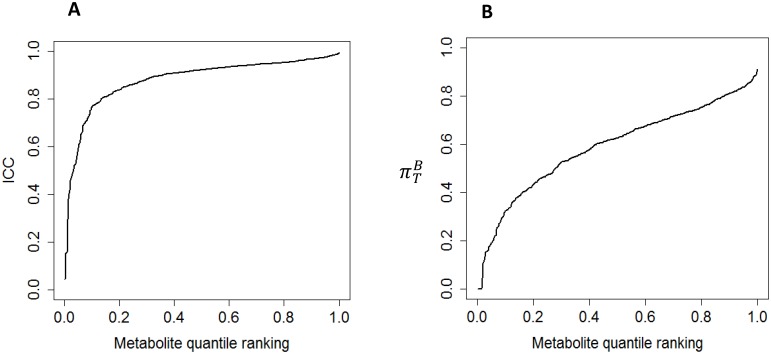
Figure 1. The plots illustrate the distribution of technical ICCs (A) and  (B) of overnight urinary samples in the Navy Colon Adenoma Study.
The ICC is a measure of laboratory variability. The  is a measure of between-individual variance. The curves illustrate the ICC and
  for the specified metabolite quantile ranking. Median ICC: 0.92. Median
  : 0.62.

