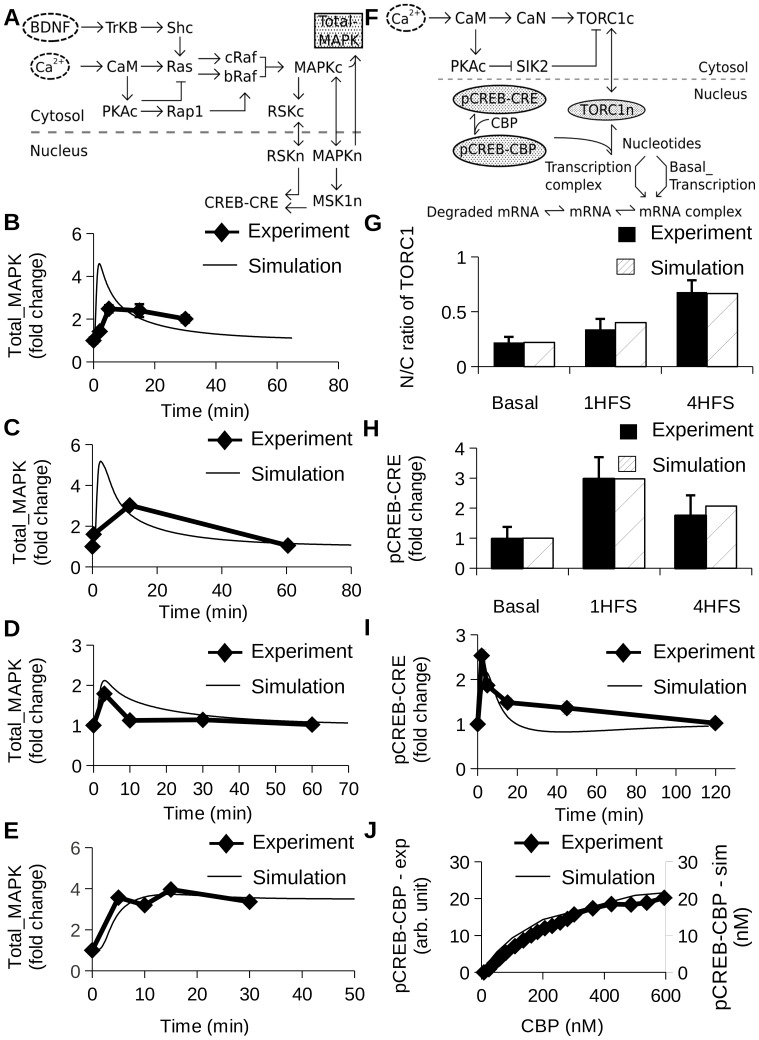
Figure 3. MAPK and TORC1/CREB sub-models and parameterization.
Except for panel G and J, all graphs report how many fold the measured molecule changes with respect to baseline levels. (A) Block diagram of MAPK sub-model. The shaded gray oval highlights total phosphorylated MAPK, which was compared with experiments in panels B, C, D and E. (B) Time course of Total_MAPK in presence of LTP (100 Hz for 1 sec) [55]. (C) Time course of Total_MAPK in presence of 90 mM K+ solution for 3 min [40]. (D) Time course of Total_MAPK following an LTP stimulus [58]. A tetanus of 100 Hz frequency and 1 sec duration was applied two times with a 20 sec interval between tetani. (E) Time course of Total_MAPK [59] in presence of 2 nM BDNF stimulus for indicated time points. (F) Block diagram of sub-model including TORC1, CREB and mRNA synthesis (G) N/C fluorescence ratio of TORC1 in presence of L-LTP (four pulses of 100 Hz for 1 sec after every 5 min) [60]. (H) Relative increase in pCREB-CRE in presence of L-LTP (four pulses of 100 Hz for 1 sec after every 5 min) [60]. (I) Time course of pCREB-CRE in presence of 50 Hz for 18 sec [67]. (J) Dose-response for pCREB-CRE with change in CBP [68].

