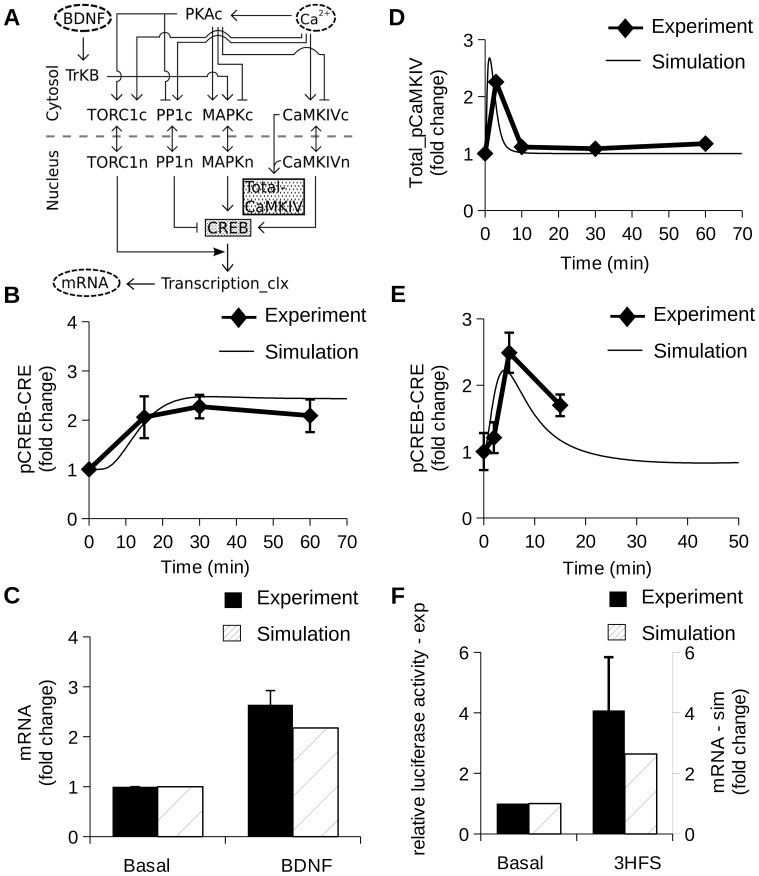
Figure 4. Composite model and parameterization.
All the graphs show relative increase in level of read-outs with respect to baseline level. (A) Block Diagram of composite model with calcium and BDNF as an input. The shaded gray boxes represent the molecules measured for constraining the model. (B) Time course of pCREB-CRE [69] in presence of 2 nM BDNF stimulus for indicated time points. (C) Relative increase in mRNA synthesis rate following 4 nM BDNF stimulation [70]. (D) Time course of Total_pCaMKIV following an LTP stimulus [58]. A tetanus of 100 Hz frequency and 1 sec duration was applied two times with a 20 sec interval between tetani. (E) Time course of pCREB-CRE in presence of E-LTP (100 Hz tetanus for 1 sec) [55]. (F) Relative increase in mRNA synthesis after LTP induction (three pulses of 100 Hz for 1 sec separated by 5 min) [71].

