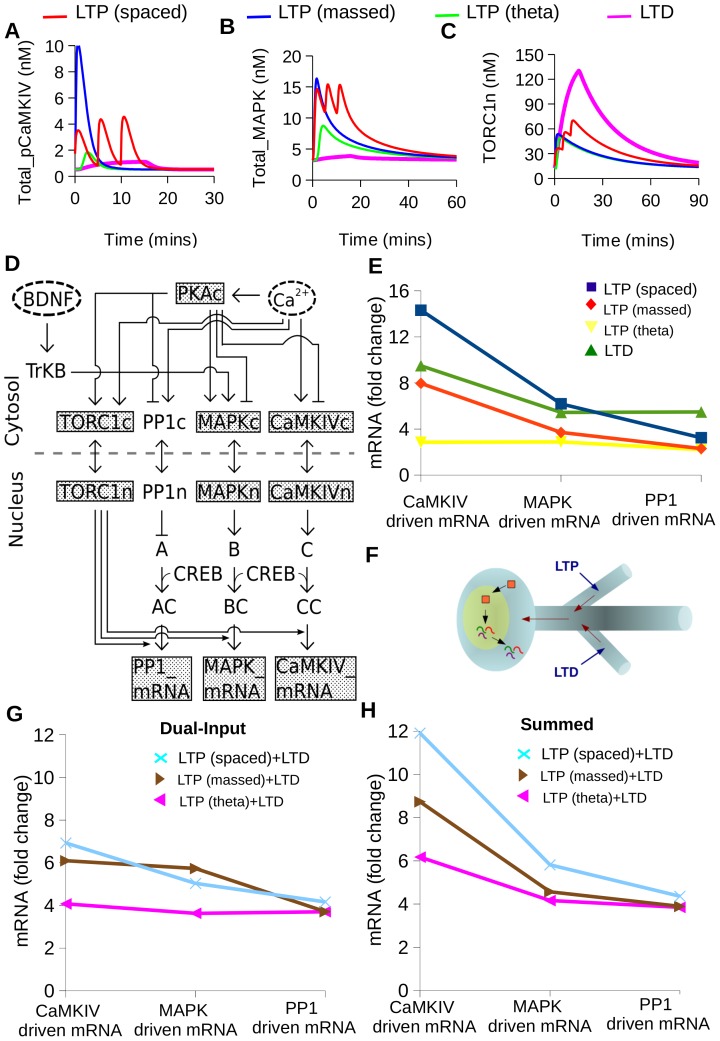
Figure 7. Differential synthesis of mRNA.
Distinct activation profiles of (A) Total_pCaMKIV, (B) Total_MAPK and (C) TORC1n to four different temporal patterns of stimulation (spaced-LTP (ITI - 300 sec), massed-LTP (ITI - 10 sec), theta burst, and LTD). (D) Block diagram of an alternate model where CaMKIV, MAPK and PP1 pathways each leading to synthesis of different mRNA transcripts. (E) Distinct expression profiles of different mRNA transcripts for each of the four stimulus patterns. (F) Schematic showing two different branches of a neuron where one branch receives LTP stimulus and the other branch receives LTD stimulus. The LTP and LTD inputs are represented by blue arrows and the direction of information flow is shown by red arrows. The red blocks represent signaling molecules and the wavy colored lines represent mRNA (G) mRNA expression profiles for combinations of stimulus patterns. The stimulus combination presented were LTD plus different variants of LTP stimuli. (H) Expression profile for combined input computed by the arithmetic sum of the contributions from individual inputs. This is strikingly different from the simulated response in Fig. 7G.

