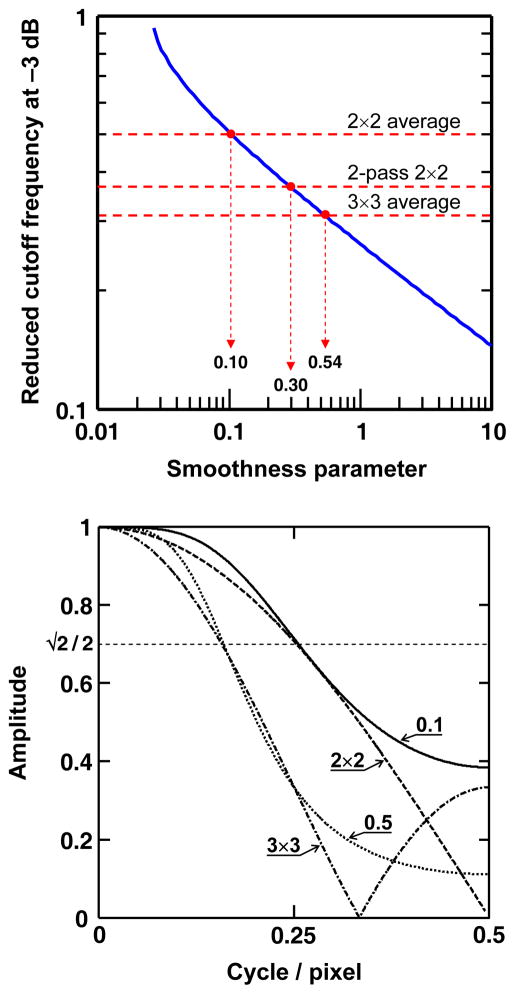
Figure 1.
Top panel: Reduced cut-off frequency of the DCT-PLS (at −3dB) as a function of the smoothness parameter (s). The cut-off frequencies of common average filters are also represented (dashed horizontal lines). Bottom panel: Spatial frequency responses (SFR) of the DCT-PLS for two s values (0.1 and 0.5). The SFR of the 2×2 and 3×3 average filters are depicted for comparison. The dashed horizontal line corresponds to the −3dB limit.

