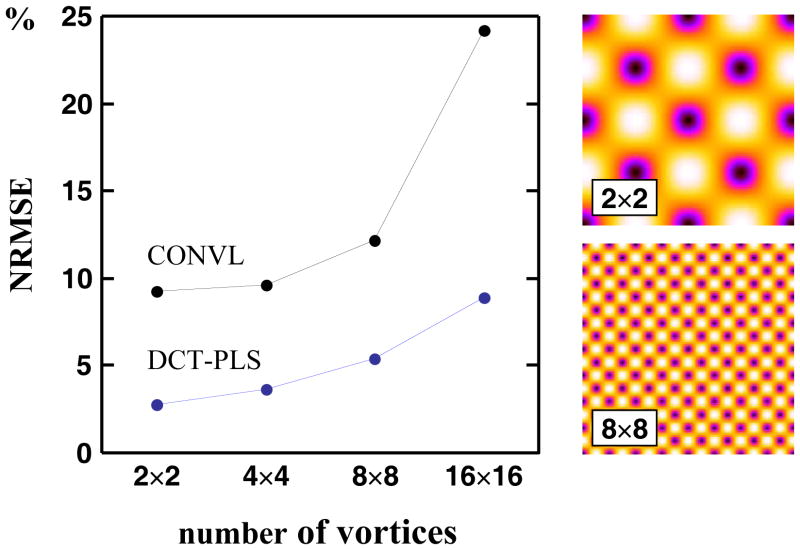
Figure 12.
Left panel: effect of the number of vortices on the normalized root mean squared error (NRMSE): comparison between the DCT-PLS and the conventional method (CONVL). Velocity field size = 128×128, noise standard deviation = 0.1×Vmax, percentage of spurious vectors = 10%. Right panels: two velocity amplitude fields (before being corrupted) are represented for an illustrative purpose (2×2 and 8×8 vortices).

