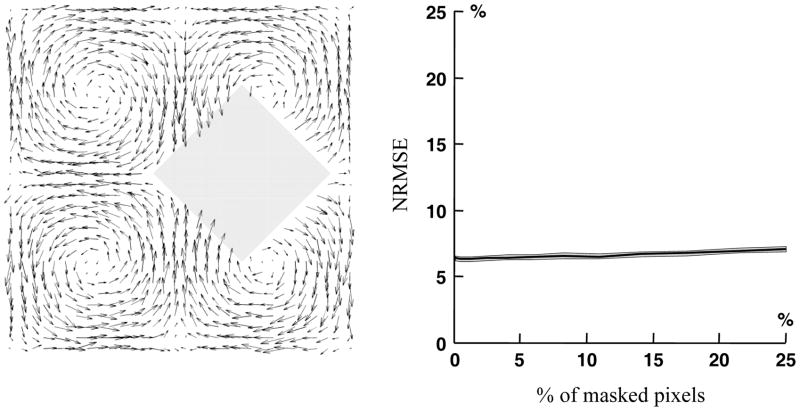
Figure 6.
Effect of masks on the post-process of the vortical flow (noise STD = 10% Vmax) with the DCT-PLS. Left panel: one example with a diamond-shaped mask of radius 8 pixels. Right panel: normalized root mean squared errors (between the post-processed and original velocity fields) as a function of percentage of masked pixels.

