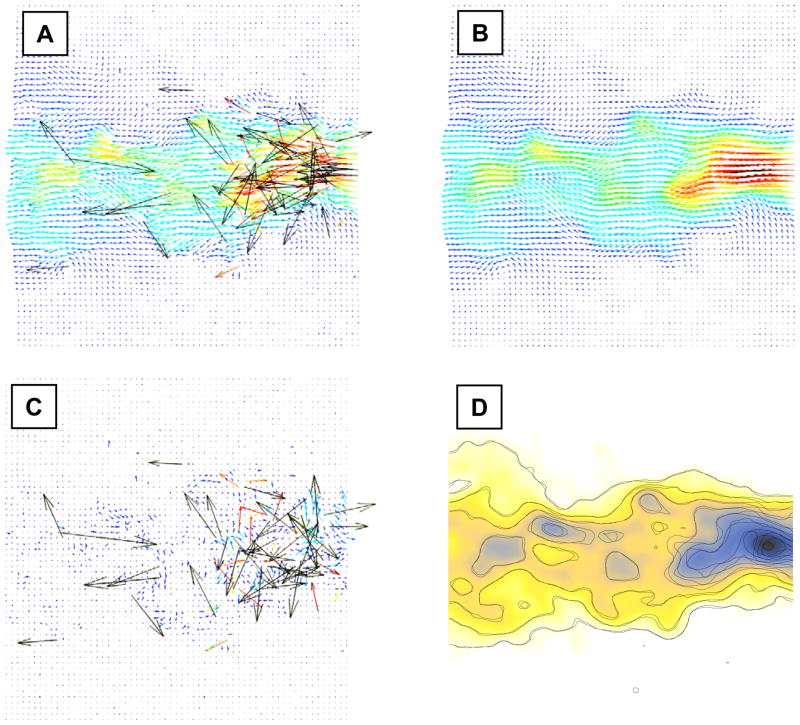
Figure 7.
Experimental PIV data measured in a turbulent jet (from Westerweel et al., see text for details). A) Raw PIV velocities. B) PIV velocities post-processed with the DCT-PLS. C) Residuals (velocities in A – velocities in B). D) Contour plots of the velocity magnitudes (solid lines: using the DCT-PLS, dashed lines: using the conventional method). The background represents the velocity magnitudes obtained with the DCT-PLS (Fig. 7B).

