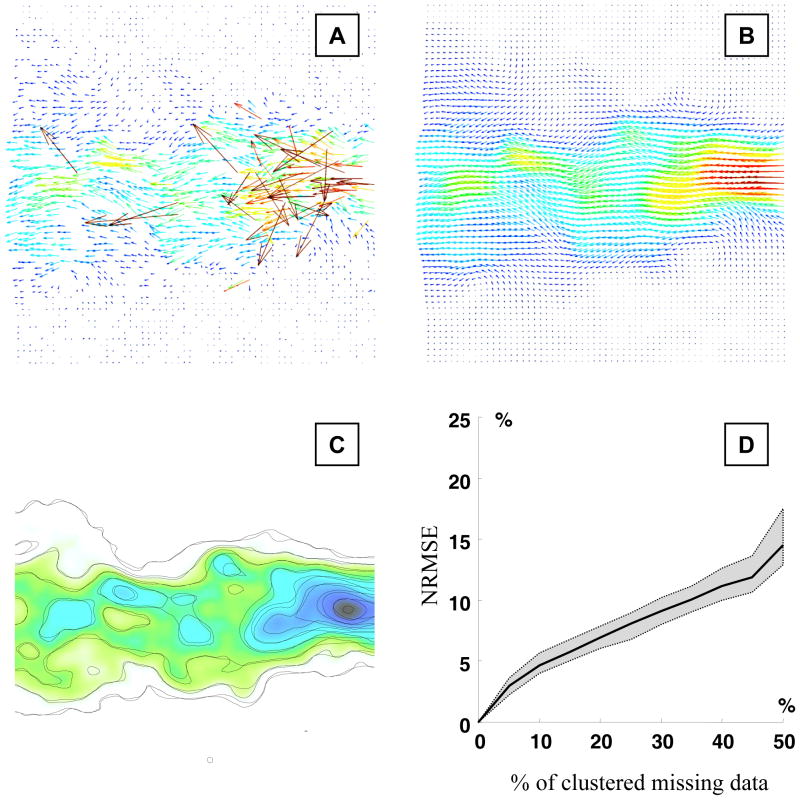
Figure 9.
Efficiency of the DCT-PLS with missing data. A) 50% of vectors have been randomly removed from the raw PIV velocities illustrated in Fig. 7A. B) The DCT-PLS reconstructed the velocity field with reasonable accuracy (compare with Fig. 7B). C) Contour plots of the velocity magnitudes (solid lines: using the DCT-PLS on the raw PIV data of Fig. 7A, dashed lines: using the DCT-PLS on the modified raw PIV data of Fig. 9A). The background represents the velocity magnitude obtained with the original raw data (Fig. 7B). D) Effect of the percentage of missing vectors on the normalized root mean squared error (NRMSE, see equation 8) between the post-processed PIV fields with missing vectors (turbulent jet, see Fig. 9B) and the post-processed PIV field without missing data (see Fig. 7B).

