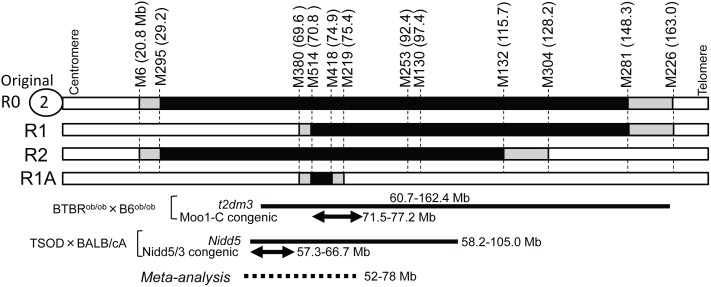
Figure 1. The genomic construct of congenic lines used to narrow T2dm2sa QTL location.
The genome of each line has an SM/J background (white boxes) and was replaced by donor A/J genomic intervals (black boxes). Gray boxes show that it is not clear whether the genomic intervals were derived from A/J or from SM/J mice. Two bold solid lines indicate the genomic intervals of QTLs (t2dm3 and Nidd5) for type 2 diabetes in BTBR mice [6], [7] and TOSD mice [9], respectively. Two arrows indicate the genomic regions affecting the diabetic phenotypes, which were confirmed by using Moo-C [7], [8] or Nidd5/3 [10] congenic strains. The dotted line indicates the genomic interval detected by meta-analysis for the diabetes-related QTLs of rodents [12].

