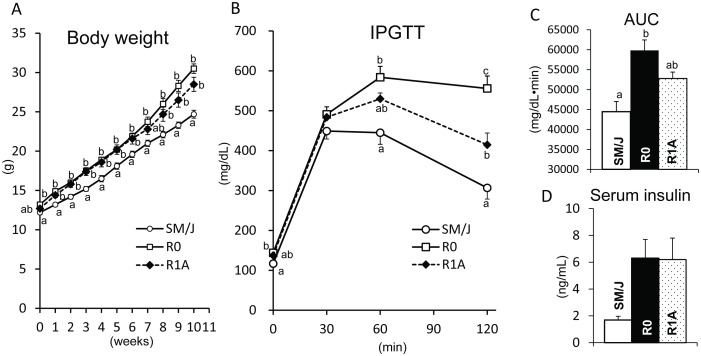
Figure 3. Diabetes-related traits in SM/J, original congenic R0, and congenic R1A strains.
A. The body weight, B. blood glucose concentrations and C. AUC during the glucose tolerance test, and serum insulin concentrations under a high-fat diet feeding. abc,Means not sharing a common superscript letter were significantly different among SM/J, R0, and R1A congenic strains by Tukey-Kramer test.

