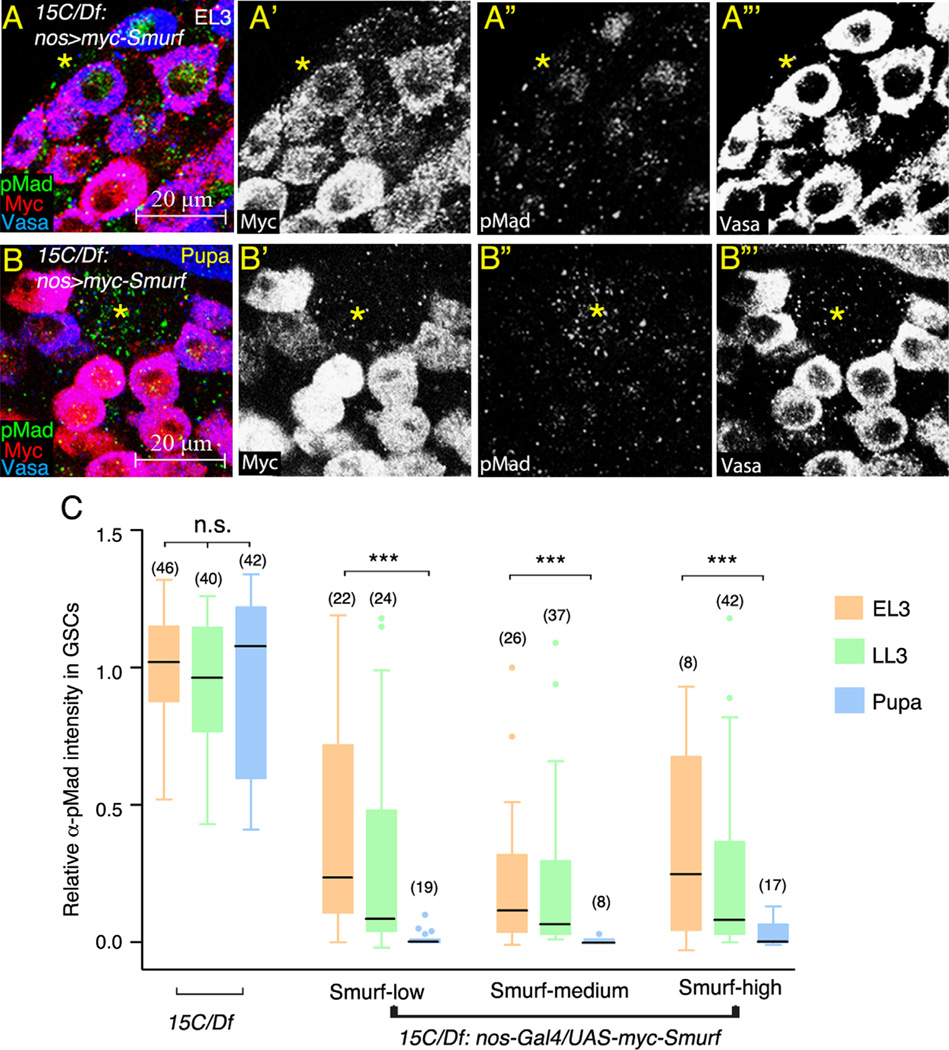
Figure 8.
Stage-dependent and concentration-independent suppression of pMad accumulation by exogenous Smurf. (A and B) Developing Smurf15C/Df7149; nos-Gal4/UAS-myc-Smurf testes immunostained for pMad (green), co-stained with anti-Myc (red) and anti-Vasa (blue) antibodies. (Asterisk) hub. (A) EL3 testis. (B) 0–4 h APF testis. (C) Box-and-whisker plot of the relative α-pMad intensity in EL3, LL3 and pupal GSCs expressing low, medium or high levels of Myc-Smurf. Significantly higher levels of pMad observed in EL3 GSCs compared to pupal GSCs. The average α-pMad intensity in Smurf15C/Df7149 EL3 GSCs was set as 100%. Boxes present the first and third quartile and the horizontal lines within boxes represent the median value. The 1.5 × interquartile range and the outliers are shown by whisker and dots. Significance was evaluated by Mann–Whitney test. ***p<0.001. n.s.=not significant (p>0.05). Numbers in parenthesis represent the number of GSCs scored. At least eight testes were scored for each group at each time point.

