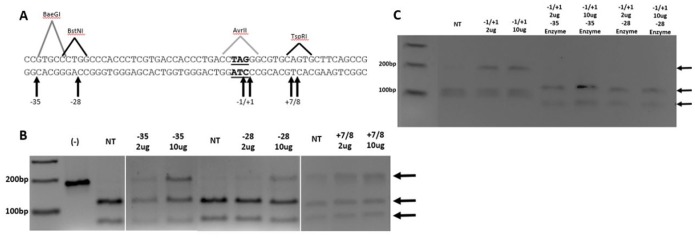
Figure 5. Analyses of inherent TALEN activity within the eGFP gene region.

(A) Segment of 181 bp PCR product with specific TALEN cut sites indicated by the arrows below and restriction enzyme recognition sequence above. (B) 2% TBE agarose gel analysis of RFLP sites created through site-specific TALEN activity. Expected bands are indicated by arrows: 181 bp for active TALENs, 68+113 for BaeGI (−35), 69+112 for BstNI (−28) and 112+69 for TspRI (+7/8). (C) 2% TBE RFLP analysis of active gene editing site (−1/+1) and controls. Expected bands are indicated by arrows: 181 bp for active TALENs and 95+86 for AvrII (−1/+1). (−1/+1) treated samples were treated with BaeGI and BstNI enzymes to show specificity of TALEN activity, expected bands are indicated by the lower two arrows (68+113, 70+111).
