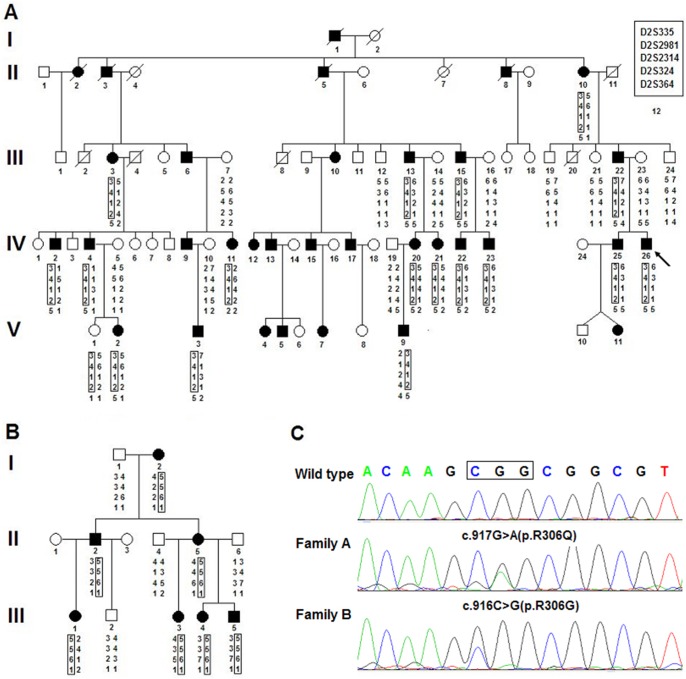
Figure 1. Pedigree, haplotype analysis, and mutation analysis of the families in this study.
A: Pedigree and disease-haplotype segregation of family A. Blackened symbols represent affected individuals with an abnormal limb phenotype. White symbols represent individuals with a normal limb phenotype. Circles and squares indicate females and males, respectively. The arrows identify the proband and the disease-haplotype is boxed. B: Pedigree and disease-haplotype segregation of family B. C: HOXD13 missense mutations in the two families.

