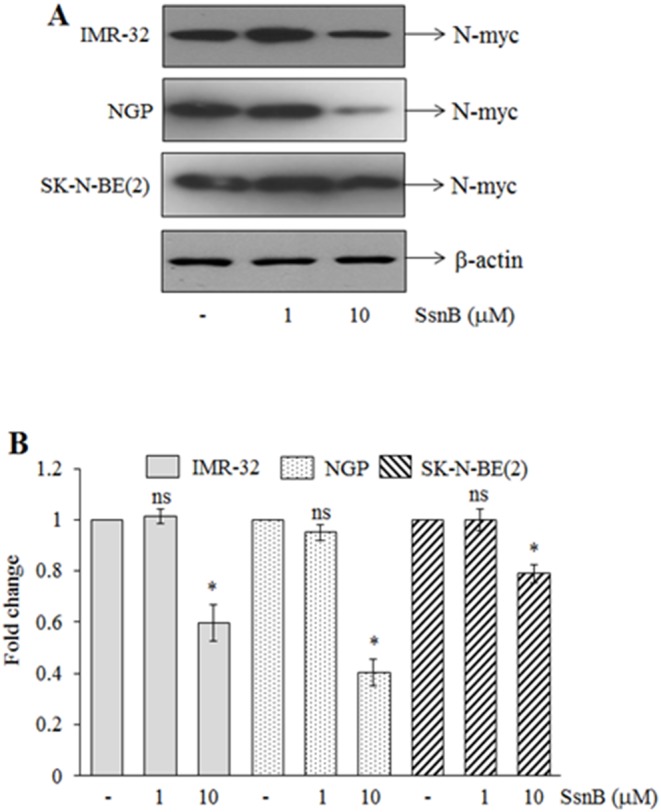
Figure 4. N-myc protein level in IMR-32, NGP and SK-N-BE(2) cells.

(A) Representative Western blots for N-myc protein in total cell extract prepared from IMR-32, NGP and SK-N-BE(2) cells treated with or without SsnB (1 µM or 10 µM) for 2 days, 3 days or 4 days, respectively. β-actin was used to check loading differences. (B) Bar diagram represents the fold change in N-myc protein signals as measured by imageJ programme. Bar represents mean and S.D. of three independent experiments and *p<0.05, SsnB 10 µM vs control; ns = nonsignificant vs control.
