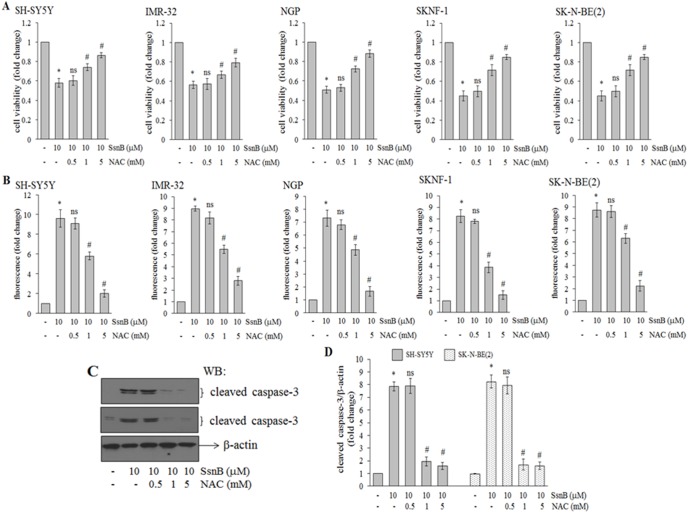
Figure 5. N-acetylcysteine (NAC) attenuates the inhibitory effects of SsnB.
(A) Neuroblastoma cells were pretreated with NAC (0.5, 1 or 5 mM) for 1 h followed by SsnB (10 µM) treatment for 2 days (SH-SY5Y and IMR-32), 3 days (NGP) or 4 days (SKNF-1 and SK-N-BE(2) cells) and after treatments MTT cell viability assays was carried out. Bar represents mean and S.D. of three independent experiments and *p<0.05 vs control; ns = nonsignificant vs SsnB 10 µM; #p<0.05 vs SsnB 10 µM. (B) Bar diagram representing the fold change in H2DCFDA-fluorescence intensity in cells treated with SsnB (10 µM) alone or in combinations with NAC (0.5, 1 or 5 mM) as mentioned above. After labelling with H2DCFDA dye (25 µM) for 30 min fluorescence intensity was monitored at excitation wavelength 485 nm and emission wavelength 530 nm. Bar represents mean and S.D. of three independent experiments and *p<0.05 vs control; ns = nonsignificant vs SsnB 10 µM; #p<0.05 vs SsnB 10 µM. (C) Representative Western blots demonstrating level of cleaved caspase-3 in total cell protein isolated from SH-SY5Y (upper panel) and SK-N-BE(2) cells (lower panel) treated with NAC (0.5, 1 or 5 mM) and SsnB (10 µM) alone or in combinations for 2 days and 4 days, respectively. β-actin was used to check loading differences. Bar diagram represents the fold change in protein levels as measured by imageJ programme (D). Bar represents mean and S.D. of three independent experiments and *p<0.05, SsnB 10 µM vs control; ns = nonsignificant vs control; #p<0.05 vs SsnB 10 µM.

