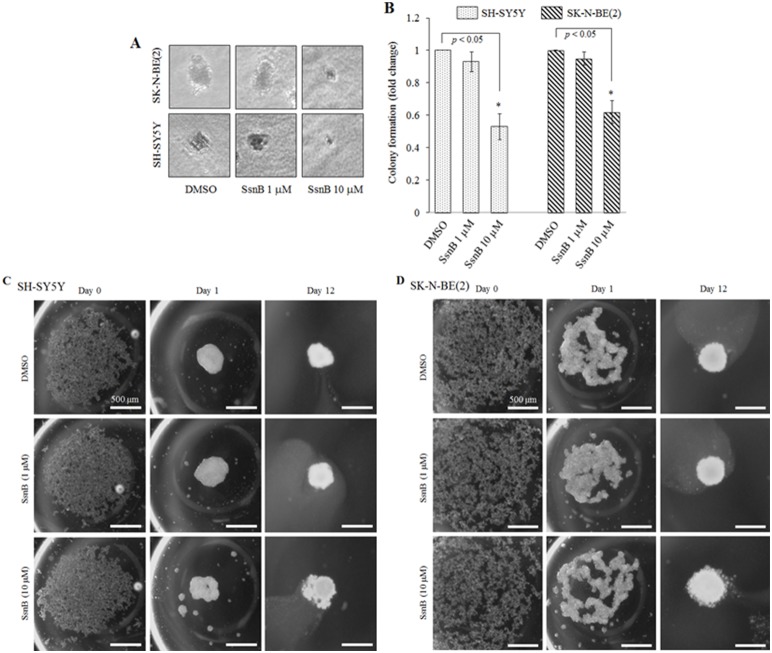
Figure 6. SsnB reduces the tumorigenicity of neuroblastoma cells.
Phase contrast images showing neuroblastoma colonies formed after treatment with SsnB (1 and 10 µM) for 45 days in anchorage-independent agarose gel colony formation assay (A). The number of colonies was counted and plotted (B). Bar represents mean and S.D. of three independent experiments and *p<0.05 was considered significant. (C and D) SsnB inhibits the neuroblastoma spheroid formation. Phase contrast images showing spheroid formation in absence or presence of SsnB (1 or 10 µM) in 3-D hanging drop assay. Twenty microliter drop containing 20,000 cells (SH-SY5Y, C; and SK-N-BE(2) cells, D) were pipetted on the lower side of the lid of petri dish. The lid was gently inverted, placed on top of the petri dish and let them grow at 37°C. On day 0, day 1 and day 12 the image of cells in each droplet was taken by Olympus inverted microscope to monitor the spheroid formation. Scale bar = 500 µm.

