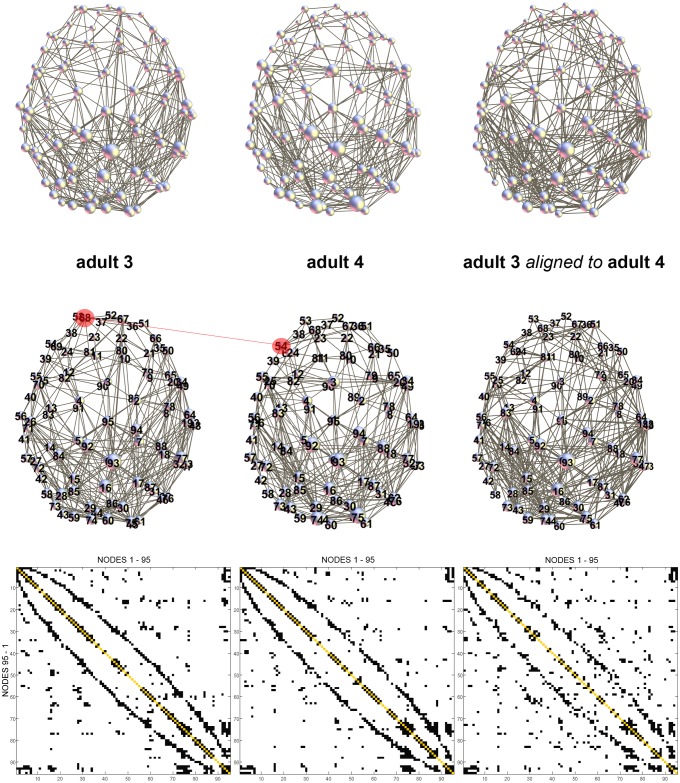
Figure 6. Example of network alignment for two adult brains (adult 3 and adult 4).
Before alignment: R = 0.6019. After alignment: R = 0.6481. Many nodes of the adjacency matrix representing adult 3 stayed in the same location after reordering (see Table 1 for reordered indices). However, some nodes switched positions with its neighbors, e.g., as highlighted in red color: node 68 in adult 3 was aligned with node 54 in adult 4.

