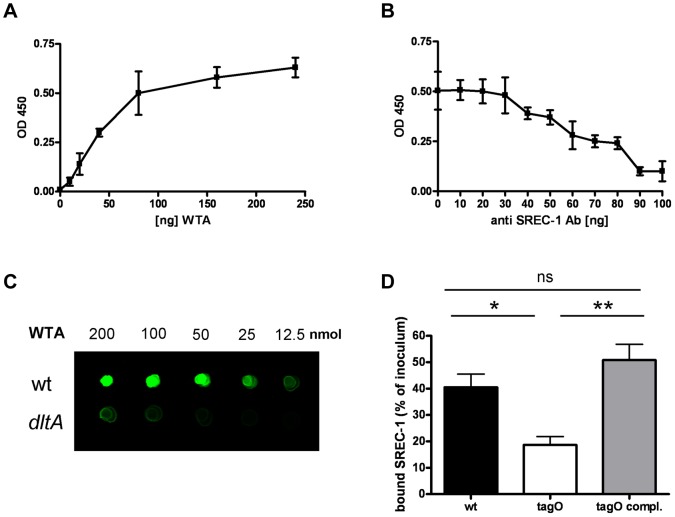
Figure 2. Direct interaction of SREC-I and WTA.
Binding of SREC-I to WTA in a microtiter plate-based assay with immobilized WTA at different concentrations. Interaction of a biotin-labeled SREC-I Fc-chimera with WTA was detected with a Streptavidin-HRP conjugate. The data represent means ± SD of 3 independent experiments. (A). Incubation with increasing concentrations of an SREC-I function blocking antibody at a concentration of 80 µg/ml immobilized WTA. The data represent means ± SD of 3 independent experiments. (B).Interaction of WTA spotted in increasing concentrations on a nitrocellulose membrane with a SREC-I Fc-chimera (500 ng/ml)(C). Bound SREC-I Fc-chimera was detected with a secondary antibody coupled to an 800 nm emitting infrared dye on a LI-COR Odyssey infrared imaging system. A representative experiment is shown here (C). Binding of SREC-I to whole bacterial cells, measured with a FITC-labeled SREC-I Fc-chimera. Wild-type S. aureus, the isogenic tagO mutant and the complemented mutant (tagO-pRBtagO) were incubated with 50 µg/ml FITC-labeled SREC-I. The bound fluorescence was calculated by subtracting the unbound fluorescence from the total fluorescence of the FITC-labeled SREC-I solution. The mean and SD of 3 independent experiments are shown. Statistical analysis was performed by Student's t-test. Significant differences vs. wild-type strains are indicated by one (P<0.05), two (P<0.01), or three (P<0.001) asterisks (*) (D).

