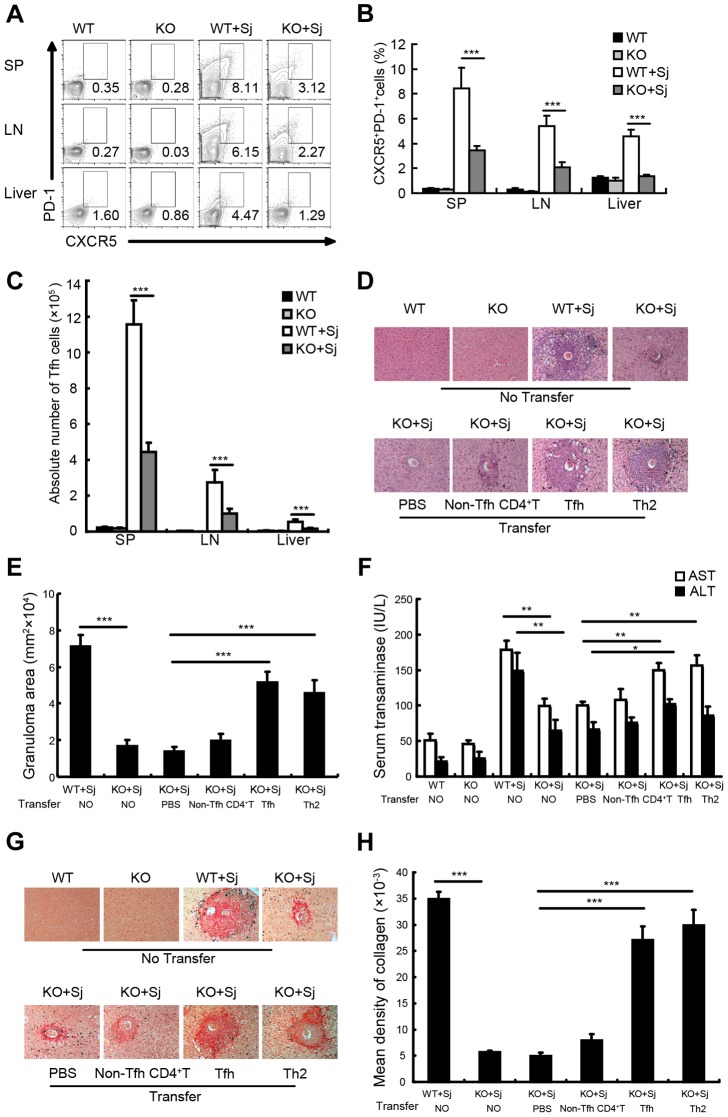
Figure 2. Tfh cells promote liver pathology.
(A) Mouse spleens, mesenteric LN, and livers from WT and ICOSL KO mice infected with or without S. japonicum were harvested, and cells were stained with CD3-percpcy5.5, CD4-FITC, CXCR5-APC, and PD-1-PE antibodies. Data shown are gated on CD3+CD4+ cells. Numbers represent the frequency of the boxed population within the CD4+ T cell population; (B) Data are expressed as the mean ± SD of 18 mice from three independent experiments, ***, P<0.001 (Student's t-test); (C) The absolute numbers of CXCR5highPD-1high cells in spleens, mesenteric LN, and livers from WT and ICOSL KO mice infected with or without S. japonicum were calculated. Data are expressed as the mean ± SD of 18 mice from three independent experiments, ***, P<0.001 (Student's t-test); (D) Three weeks after adoptive transfer of none, PBS, non-Tfh CD4+ T cells, Tfh cells, or Th2 as described in Materials and Methods, liver sections from S. japonicum-infected ICOSL KO recipient mice were Paraffin-embedded, formalin fixed and stained with H&E. Images shown are representative of two independent experiments. Original magnification, ×100; (E) For each mouse, the sizes of 30 granulomas around single eggs were quantified with AxioVision Rel 4.7. Data are expressed in area units. Values are given as mean ± SD of 12 mice from two independent experiments, ***, P<0.001 (Student's t-test), compared with control mice; (F) Serum samples were collected from mice three weeks after adoptive transfer of none, PBS, Tfh cells, non-Tfh CD4+ T cells, or Th2 cells. Levels of serum ALT/AST were determined. Data are expressed as the mean ± SD of 12 mice from two independent experiments, **, P<0.01; *, P<0.05 (Student's t-test); (G) Paraffin-embedded sections were stained with sirius red. Images shown are representative of two independent experiments. Original magnification, ×100; (H) The mean optical density of collagen fibers by sirius red staining was digitized and analyzed on Image-Pro Plus software. Values are given as mean ± SD of 12 mice from two independent experiments, ***, P<0.001 (Student's t-test), compared with control mice.

