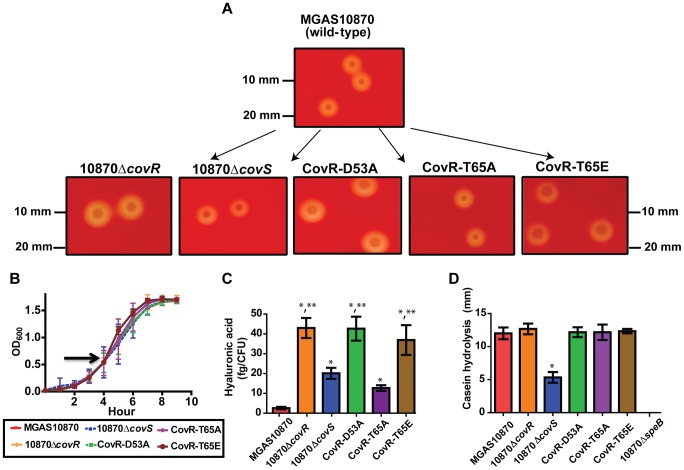
Figure 4. Growth curves and general characterization of GAS CovR/S variants.
Various GAS strains were created as described in Materials and Methods. (A) Photographs of indicated strains following overnight growth on 5% sheep blood agar plates. (B) Growth curves of various strains in THY. Arrow shows point where samples were obtained for RNA-Seq analysis. (C) Production of hyaluronic acid capsule following growth in THY. Significant elevation in hyaluronic acid production is indicated by * in comparison to strain MGAS10870 and by ** in comparison to strains MGAS10870, 10870ΔcovS, and CovR-T65A as measured by ANOVA followed by Bonferroni's post-hoc test. (D) Casein hydrolysis (marker of SpeB) activity. * indicates significant decrease in casein hydrolysis in strain 10870ΔcovS compared to the wild-type and CovR variant strains as measured by ANOVA followed by Bonferoni's post-hoc test. Strain 10870ΔspeB is included as a negative control. For (B–D), strains were grown in triplicate on three separate occasions. Data graphed are mean ± standard deviation.

