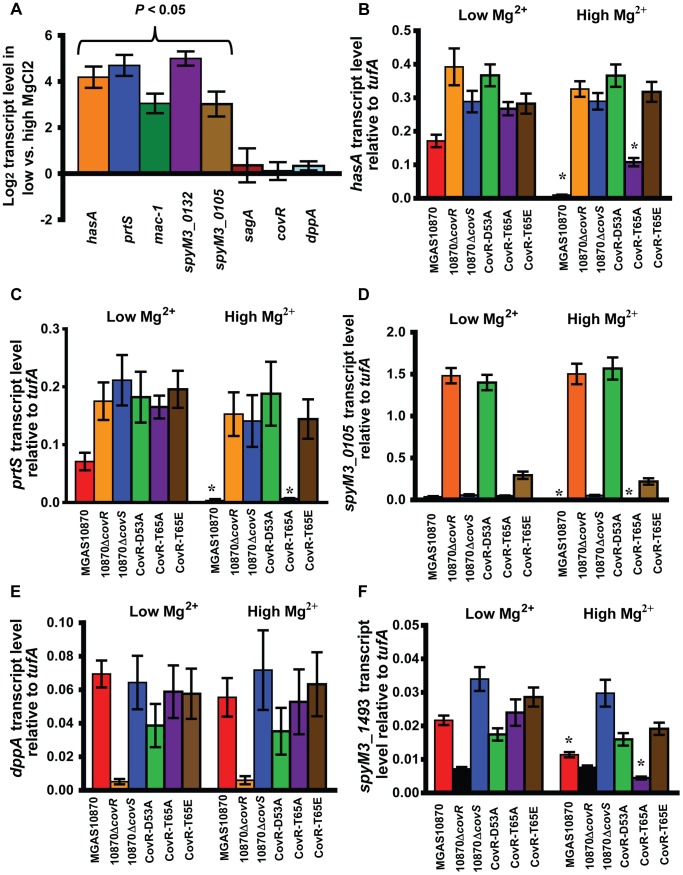
Figure 6. Strains MGAS10870 and CovR-T65A respond to changes in Mg2+.
For all panels, data shown are gene transcript levels as measured by TaqMan quantitative real-time PCR (qRT-PCR). Strains were grown in normal THY (low Mg2+) or in THY with 15 mM MgCl2 (high Mg2+) to mid-exponential phase in duplicate on two separate occasions and analyzed in duplicate. Data shown are mean ± standard deviation of 8 data points. (A) Log2 ratio of transcript levels of indicated genes during growth in low vs. high Mg2+ medium in strain MGAS10870. P value refers to Student's t-test comparing gene transcript levels in low vs. high Mg2+ medium. (B–F) Data shown are transcript levels of indicated genes in indicated strains relative to the endogenous control gene tufA. * indicates significant difference in gene transcript for the indicated strain between growth in a low Mg2+ vs. high Mg2+ conditions as determined by Student's t-test.

