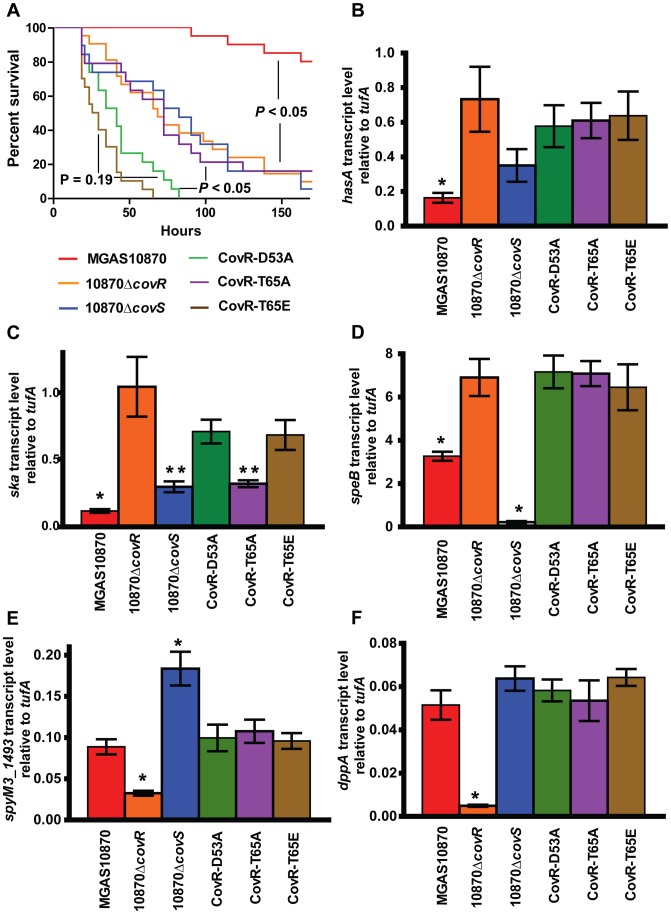
Figure 8. CovR phosphorylation affects GAS virulence and gene expression during infection.
(A) 20 CD-1 mice per strains were challenged intra-peritoneally with 1×10⁷ colony forming units of the indicated strains and followed for near-mortality. Data graphed are survival. P values refer to Mantel-Cox (log-rank) test adjusted for multiple comparisons. For (B–F), RNA was isolated from infected animals as described in the Material and Methods and converted to cDNA. Data graphed are gene transcript levels of the indicated genes relative to the endogenous control gene tufA. Four animals were infected with each strain and data were analyzed in triplicate. Data graphed are mean ± standard deviation of 12 data points. * indicates that gene transcript level for that particular strain was significantly different compared to all other strains as determined by analysis of variance (ANOVA) and Bonferroni's post-hoc test. For panel (C), ** indicates that the transcript level of ska was significantly lower in strains 10870ΔcovS and CovR-T65A compared to strains 10870ΔcovR, CovR-D53A, and CovR-T65E.

