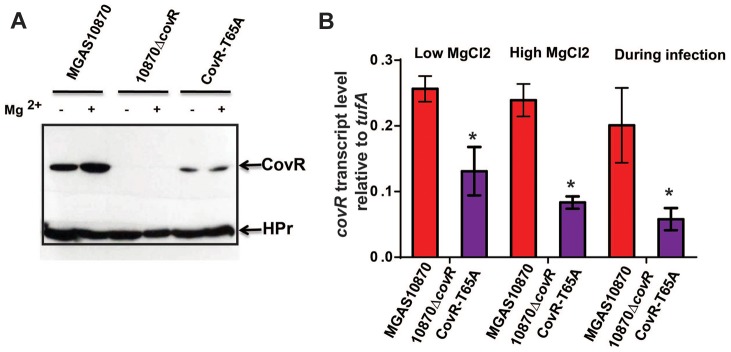
Figure 9. CovR levels are decreased in the CovR-T65A strain.

(A) Western blot analysis. Indicated strains were grown to mid-exponential phase in regular THY medium (−) and in THY medium supplemented with 15 mM MgCl2 (+). Cell lysates containing 70 µg of total protein were loaded on a 12% SDS-gel. The gel was divided into two parts; the upper part was blotted against anti-CovR antibody while the lower part was blotted against anti-HPr antibody which served as a loading control. (B) qRT-PCR analysis of covR transcript levels. For “Low MgCl2” and “High MgCl2” samples, the indicated strains were grown as for the Western blot analysis in duplicate on two separate occasions and analyzed in duplicate. Data shown are mean ± standard deviation of 8 data points. For the “During infection” samples, four animals were infected with each strain and data were analyzed in triplicate as described in Figure 8. Data graphed are mean ± standard deviation of 12 data points. For all three conditions the lack of a bar for 10870ΔcovR strain indicates no covR transcript level was detectable. * designates a significant difference in covR transcript level between strain MGAS10870 and CovR-T65A as determined by Student's t-test.
