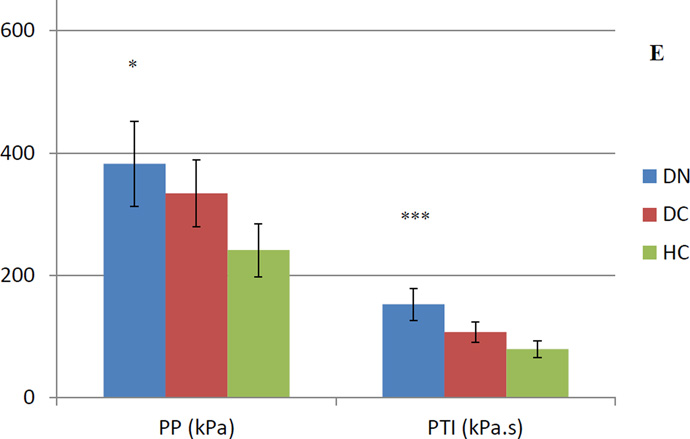
Figure 1.
Peak Pressure (PP) and pressure-time integral (PTI) values for five foot regions. A) hallux, B) lesser toes, C) medial forefoot, D) central forefoot, E) lateral forefoot
Error bars represent standard deviation. * represents a group difference between DN-HC, ** represents a group difference between DN-DC, *** represents group differences between DN-HC and DN-DC.


