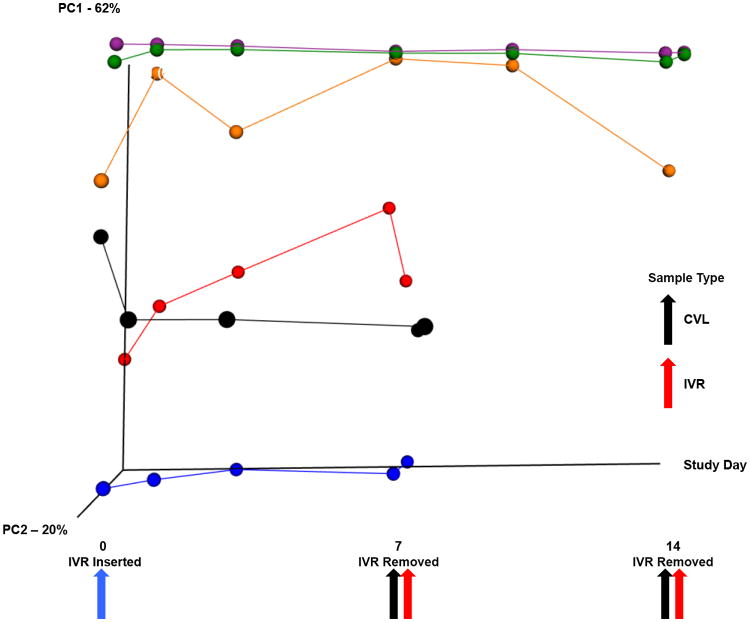
Fig. 4.
Temporal dynamics of the vaginal microbial communities. The β diversity for vaginal (CVL) and IVR samples from the 6 subjects is plotted against time. Each colored trace, and correspondingly colored circles, represents one subject who had the IVR removed either at Day 7 or Day 14 (see Fig. 1). The blue arrow points to CVL samples taken at the time of IVR insertion. The black arrows represent the CVL samples taken at the time of IVR removal (red arrows). The subject represented by the orange line and spheres has an omitted CVL sample at Day 14 as it did not meet minimum 16S processing standards.

