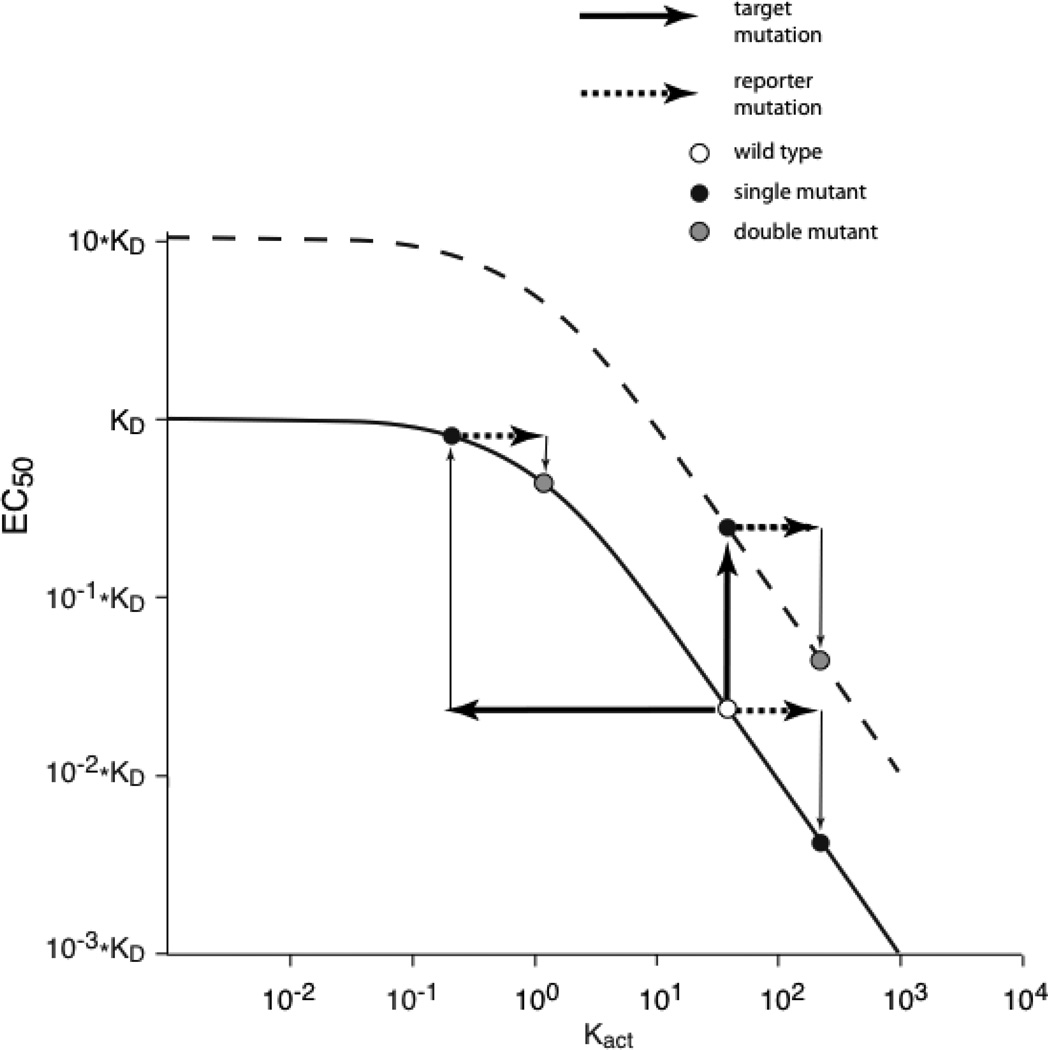
Figure 2.
Plot of EC50 versus Kact. (Solid line) Relationship between EC50 and Kact for a simple allosteric model (Eq. 1). (Dotted line) Plot of the same model, but with KD 10-fold larger. For both plots, in the high slope region changes to Kact produce significant changes in EC50 (thin arrows), as shown when the reporter mutation is made to the wild type receptor. However, for allosteric receptors with Kact in the plateau region, such as wild type receptors with high Kact into which a significant loss-of-function target mutation, a much smaller shift in EC50 is seen for equivalent shifts in Kact.

