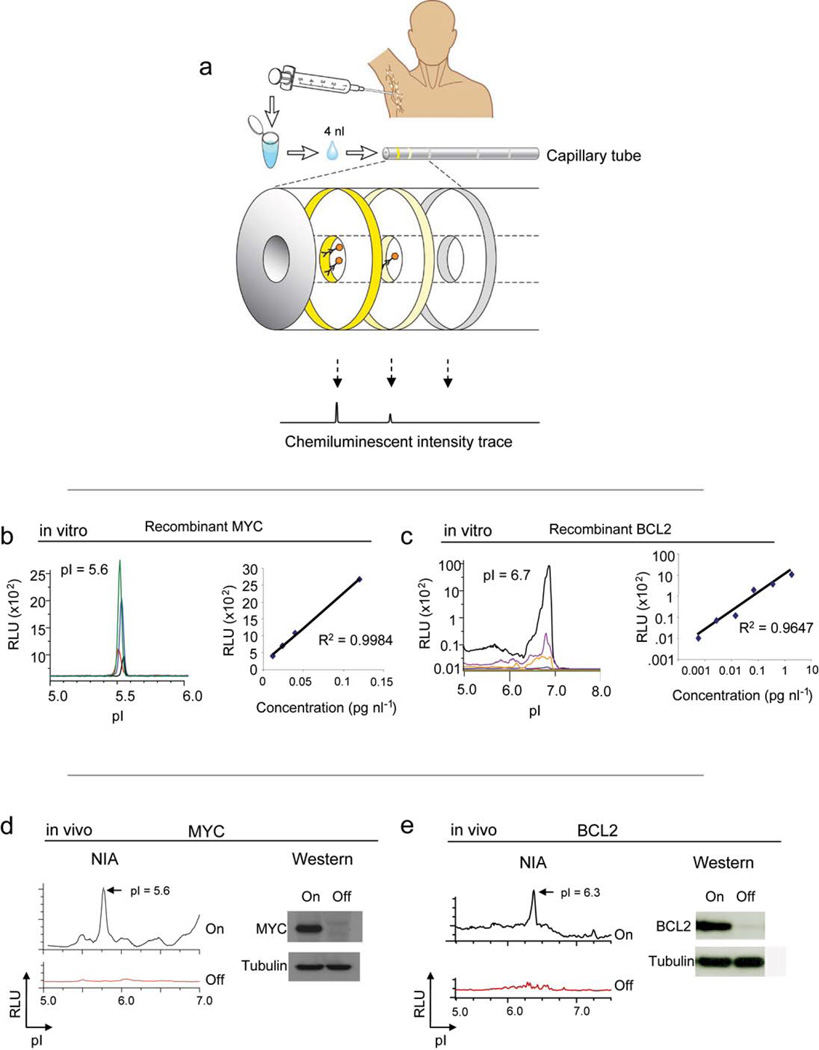
Figure 1. NIA for the quantitative analysis of oncoproteins.
(a) Schema of the use of NIA for the measurement of oncoproteins from clinical specimens. NIA can be used to measure oncoprotein expression and phosphorylation in clinical specimens. NIA incorporates charge-based separation coupled with antibody detection. (b–c) Detection of recombinant MYC or BCL2 oncoproteins by NIA. Representative NIA traces of MYC (black= 0.004 pg/nl, red= 0.012 pg/nl, blue = 0.04 pg/nl, green= 0.12 pg/nl) or BCL2 (green=0.0019 pg/nl, red=0.0075 pg/nl, blue= 0.03 pg/nl, orange= 0.12 pg/nl, purple=0.47 pg/nl, black = 1.8 pg/nl) are shown. The data is represented as the normalized peak area versus protein concentration. The calculated correlation coefficients are shown. (d–e) NIA could be used to detect oncoproteins in transgenic mouse tumors obtained from serial FNAs. Serial FNA’s were obtained from subcutaneous tumors in mice before and after the suppression of expression of MYC or BCL2. Corresponding Western analysis is also shown. Data is represented as peak areas detected by NIA; mean of three replicates per sample +/− the standard error.

