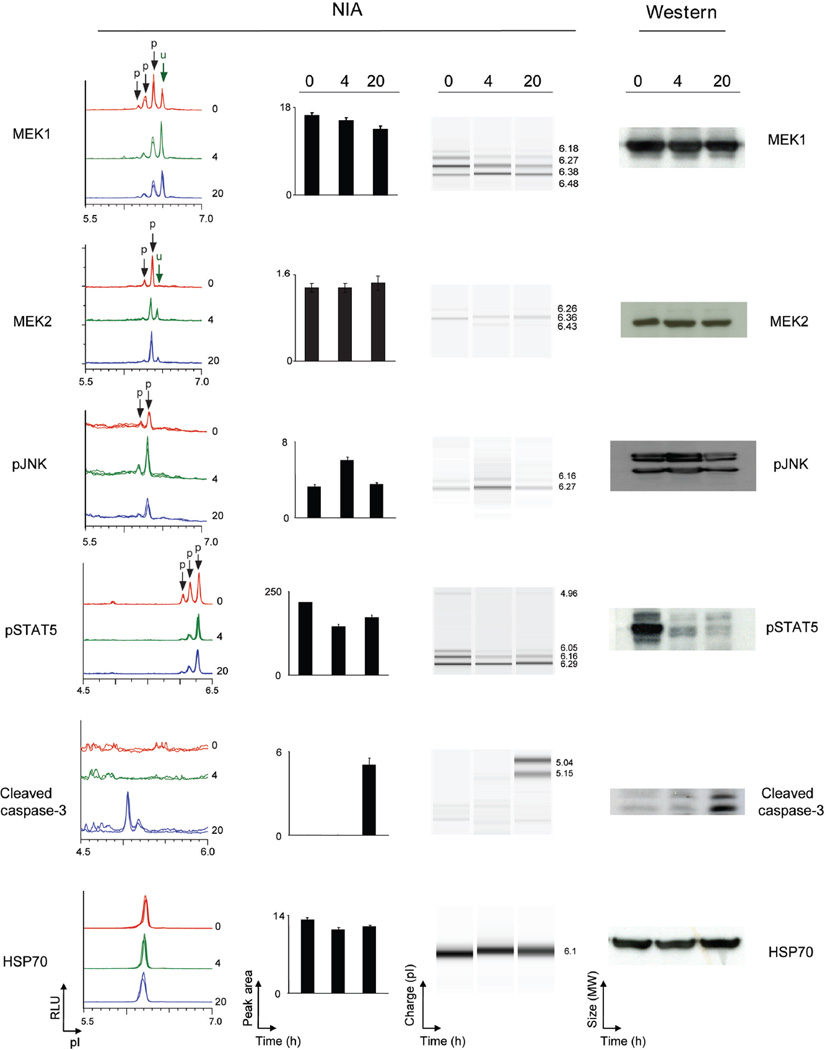
Figure 3. NIA detection of changes in oncoprotein activation in CML cells treated with imatinib.
NIA was used to quantify proteomic changes in the K562 cell line in response to imatinib in vitro in K-562 cell line was treated with imatinib in vitro for 0, 4, and 20 hours. MEK1, MEK2, pJNK, pSTAT5 and activated caspase 3 were detected by NIA (from left to right: representative traces for the protein of interest, bar graph of NIA quantification for each protein, NIA pseudoblot representation, and Western Blot data). Peaks on the traces that represent phosphorylated isoforms are indicated with black arrows. All measurements were performed in six replicates and bar graph data is represented as the mean peak area +/− standard error.

