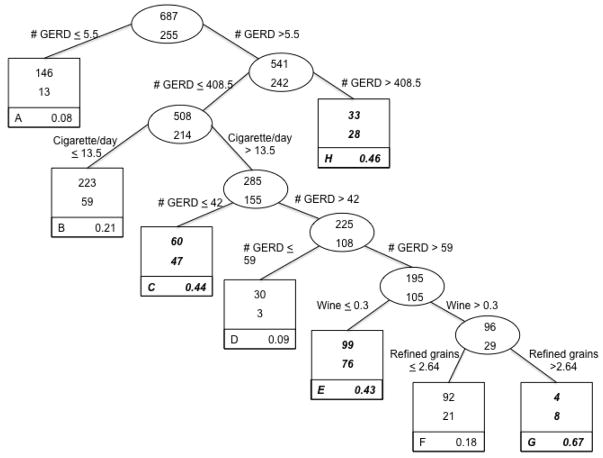
Figure 2.
Classification Tree: Lifestyle factors and risk of gastric cardia adenocarcinoma, from United States multicenter, population-based study (1993–1995).
Each group contains the number of controls (top number of uppermost box) and the number of cases (bottom number of uppermost box). Terminal subsets are represented by square boxes and are identified by letter in the lower left corner. The proportion in the bottom right corner of each terminal subset gives the probability of being a case in that group. Because the prevalence of cases in the total sample was 27%, terminal subsets comprised of more than 27% cases are considered higher risk groups for classification purposes and are highlighted in bold italics.

