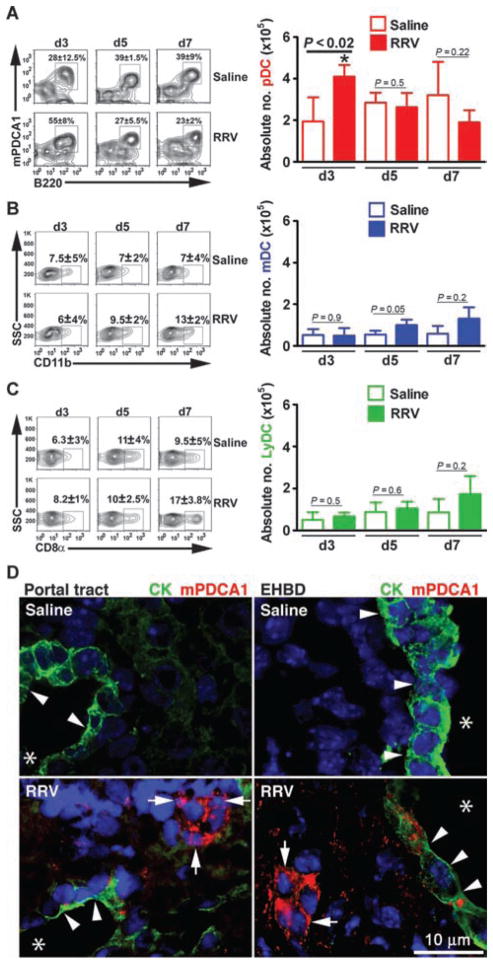
Fig. 1.
DC populations in neonatal mouse liver after RRV infection. Flow cytometric analyses of hepatic mononuclear cells from neonatal mice infected with RRV or saline control 24 hours after birth. (A to C) Analyses included an initial size gating, exclusion of 7-aminoactinomycin D–positive (7AAD+) cells, gating on CD11c+ cells, and then gating for pDCs (PDCA1+CD11b−B220+) (A), mDCs (CD11b+) (B), or LyDCs (CD8α+CD11b−) (C) at days 3 (d3), 5 (d5), and 7 (d7) after birth. The percentage of CD11c+-gated cells is shown in contour profiles in the left panels, whereas the absolute number from each liver is shown as graphs in the right panels (n = 4 to 7 livers per group per time point; shown as means ± SD of three experiments; *P < 0.02 at day 3 by Mann-Whitney test). (D) DCs are identified by immunostaining sections of livers and extrahepatic bile ducts (EHBD) 3 days after RRV challenge or saline injection in newborn mice. Sections were incubated with antibodies to cytokeratin (CK, green) to detect cholangiocytes and PDCA1 (red) to detect pDCs; nucleus is counterstained with 4′,6-diamidino-2-phenylindole (DAPI) (blue). Arrows point to pDCs, arrowheads point to cholangiocytes in the portal tract of the bile duct and extrahepatic bile ducts, and asterisks denote the lumen of bile ducts.

