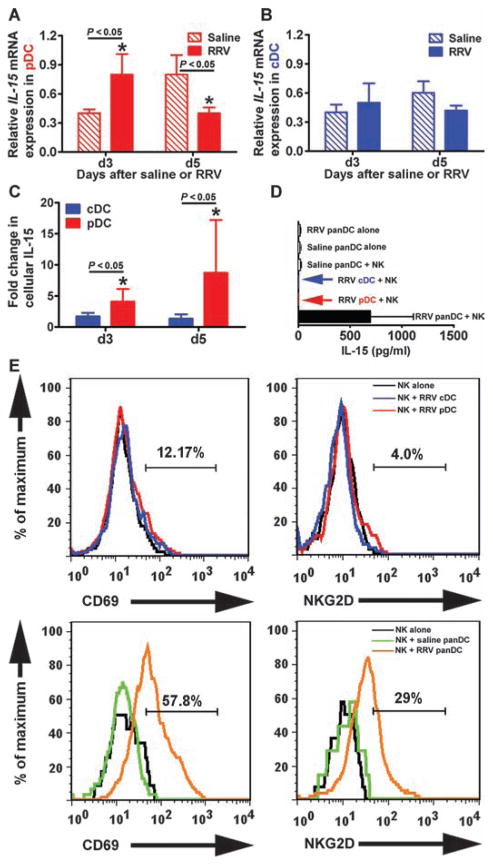
Fig. 5.
Cytokine expression by DC subtypes after RRV infection. (A and B) Expression of IL-15 mRNA (depicted as a ratio to GAPDH mRNA) by pDCs and cDCs isolated from livers of newborn mice 3 and 5 days after RRV or saline injection. (C) Intracellular staining for IL-15 in hepatic pDCs and cDCs after RRV using flow cytometric analysis. Data are shown as fold change from saline controls; hepatic mononuclear cells were pooled from four to six livers for each group and time point. (D) IL-15 concentration (mean ± SD) was measured in conditioned medium after 24 hours of coculture of hepatic NK cells with RRV-primed pDCs, cDCs, and panDCs. Arrows indicate low or nondetectable cytokine levels at the indicated culture condition; all assays were run in duplicate. (E) Expression of CD69 and NKG2D by RRV-naïve NK cells after 2 days of coculture with hepatic cDCs, pDCs, or panDCs (pDCs + cDCs) isolated 3 days after injection of RRV or saline into newborn mice (data are representative of two similar experiments and each group contains cell pools isolated from 5 to 10 livers). Values within each histogram indicate mean percent NK cells positive for CD69 or NKG2D after saline or RRV injection. *P < 0.05 by Mann-Whitney test.

