Fig. 8.
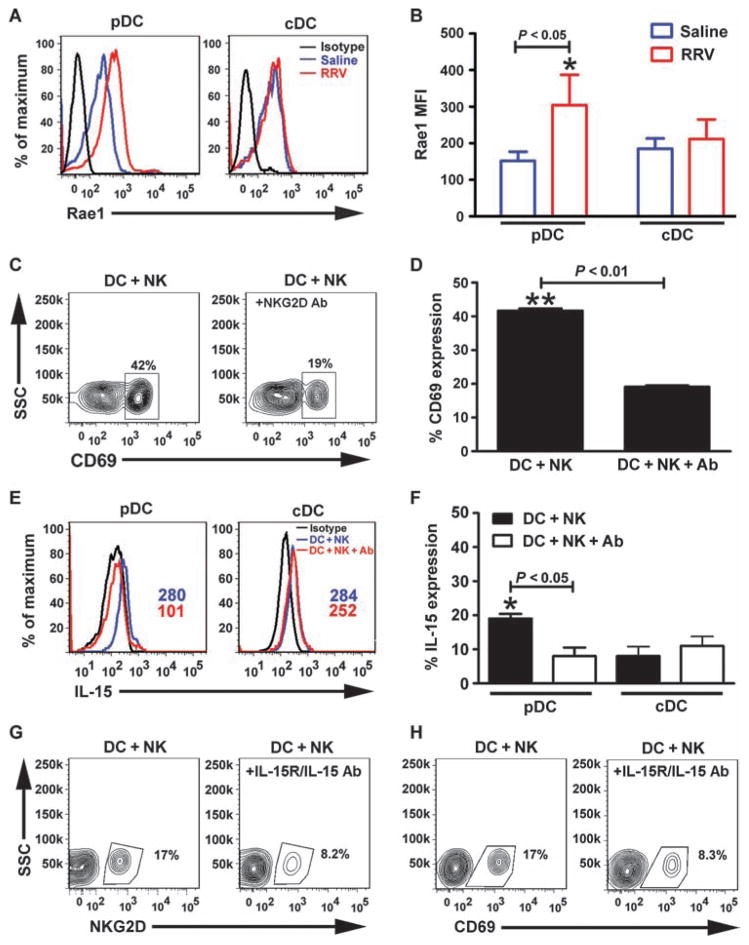
Interaction between DCs and NK cells via Rae1-NKG2D. (A) Flow cytometric histograms show an increase in expression of Rae1 in hepatic pDCs 3 days after RRV or saline injection into newborn mice; cDCs show no change in expression of Rae1. (B) Increase in Rae1 expression reached statistical significance (MFI ± SD, *P < 0.05). Data are representative of two similar experiments, and each group contains cell pools from 5 to 10 livers. (C) Contour plots show a decrease in the expression of CD69 by hepatic NK cells when anti-NKG2D antibodies were added to the medium of a 48-hour coculture of NK cells with RRV-primed hepatic panDCs. (D) Percent of NK cells expressing CD69. (E and F) Surface staining for IL-15 in pDCs and cDCs in the same experimental setting. (G and H) Contour plots show a decrease in the expression of NKG2D or CD69 after hepatic NK cells are cocultured with panDCs in the presence of anti–IL-15R/IL-15 antibodies. *P < 0.05; **P < 0.01 by Mann-Whitney test.

