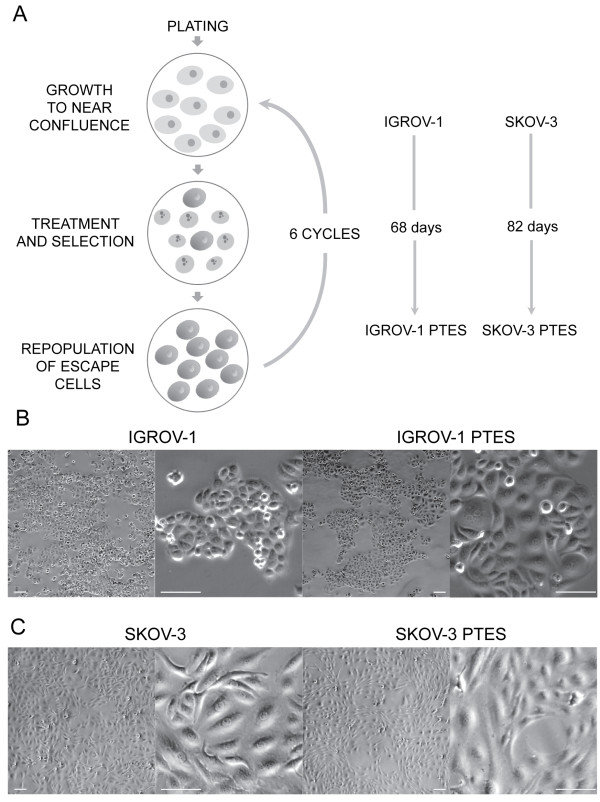
Figure 2.
Generation of ovarian cancer cells resistant to CDDP and PTX. (A) Graphical representation of the procedure performed to generate cells with lower sensitivity to both CDDP and PTX. Lighter cells represent growing cells whereas darker cells are cells that survive therapy. Cells showing nuclear fragmentation represent those dying in response to chemotherapy. Phase contrast images at lower or higher magnifications of the morphologies displayed by IGROV-1 and the IGROV-1 PTES (B) and that of SKOV-3 and SKOV-3 PTES siblings (C). Scale bar, 100 μm.

