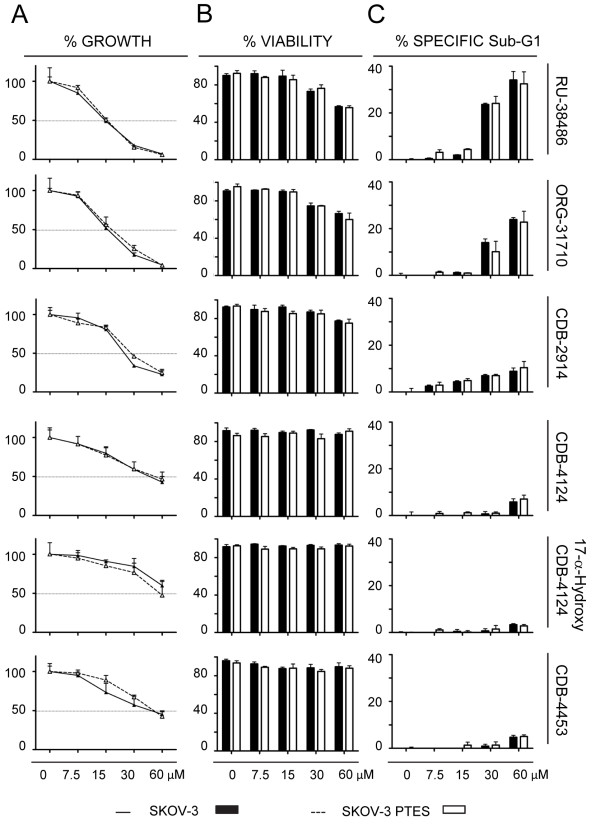
Figure 5.
Growth inhibition and lethality of antiprogestins towards SKOV-3 and SKOV-3 PTES cells. Experiments were similar to those described in Figure 4, but with a different pair of cell lines. Percent cell growth (A), percent viability (B) and percent specific Sub-G1 (C) were assessed for both cell lines in response to six different antiprogestins. Bars, mean ± s.e.m. (n = 3).

