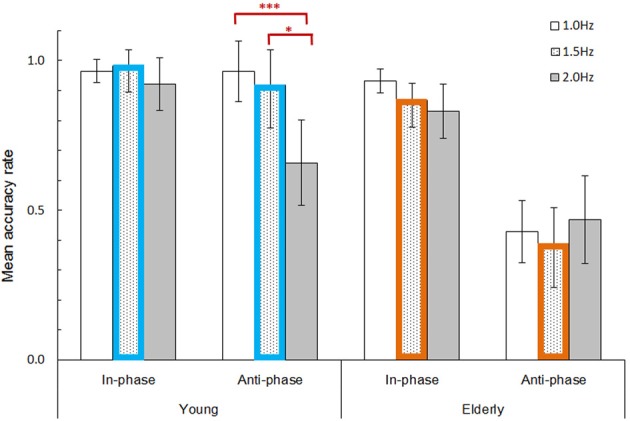
Figure 2.

Mean behavioral accuracy rate (correct movements / total button-presses) divided by mode (in- and anti-phase), pacing cue frequency (1.0, 1.5, and 2.0 Hz), and age group (young and elderly). Error bars represent 95% confidence intervals. Bar plots with colored borders (i.e., 1.5 Hz pacing frequency; blue for young, orange for elderly) denote the conditions selected for fMRI and SEM analyses. An ANOVA combined with Bonferroni post-hoc tests revealed significant differences among the three pacing frequencies for the young group's anti-phase mode. *p < 0.05; ***p < 0.001.
