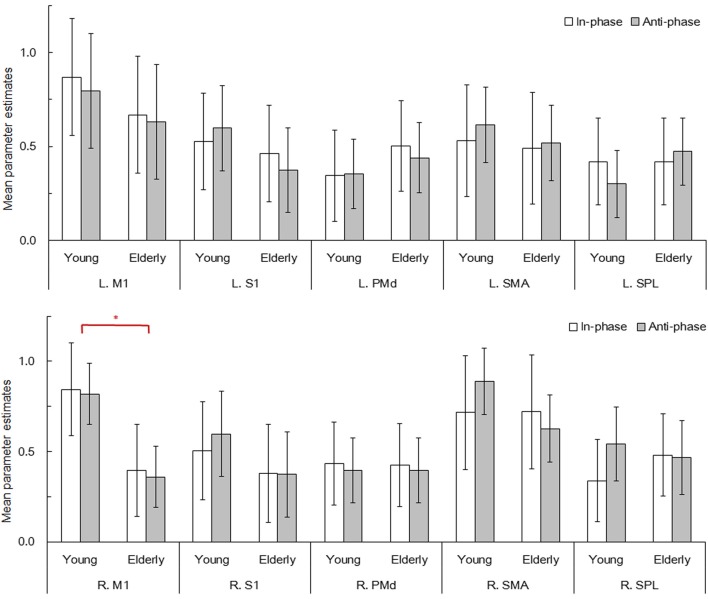
Figure 4.
Mean parameter estimates for ten ROIs during the bimanual finger movement task. Bar plots represent the movement mode (in- and anti-phase) at a 1.5 Hz visual pacing cue frequency for each of the young (n = 20) and elderly (n = 20) groups. Error bars represent 95% confidence intervals. M1, primary motor cortex; S1, primary somatosensory cortex; PMd, dorsal premotor cortex; SMA, supplementary motor area, SPL; superior parietal lobule, L; left, R; right. *p < 0.05.

