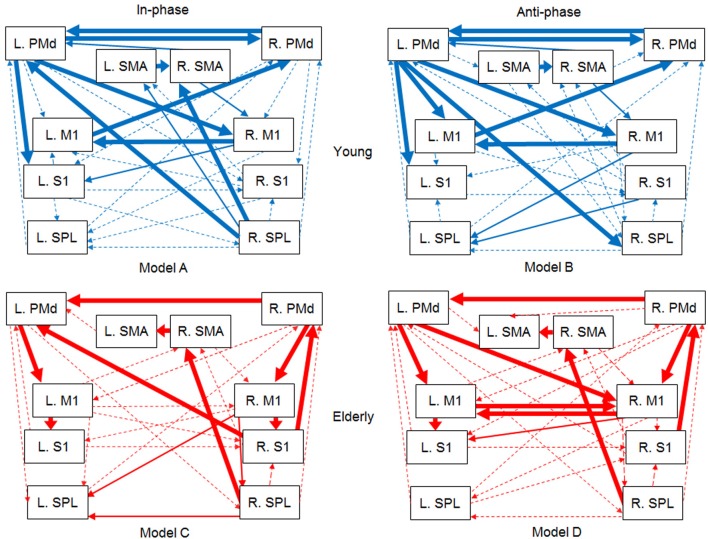
Figure 5.
Functional connectivity models between the ten ROIs within the motor association cortex during the bimanual finger movement task. The models are presented for each condition of the in-phase (model A) and anti-phase (model B) modes for the young group, and the in-phase (model C) and anti-phase (model D) modes for the elderly group. The ROIs applied to SEM as observed variables are presented in rectangles. The dependent measure was parameter estimate obtained from each ROI. Measurement error terms are not shown. M1, primary motor cortex; S1, primary somatosensory cortex; PMd, dorsal premotor cortex; SMA, supplementary motor area, SPL; superior parietal lobule, L; left, R; right. The thickness of the arrows represents the significance levels of standardized path coefficients (β) among the mean parameter estimates of the ROIs as follows:  p < 0.001;
  p < 0.01;
  p ≥ 0.01.

