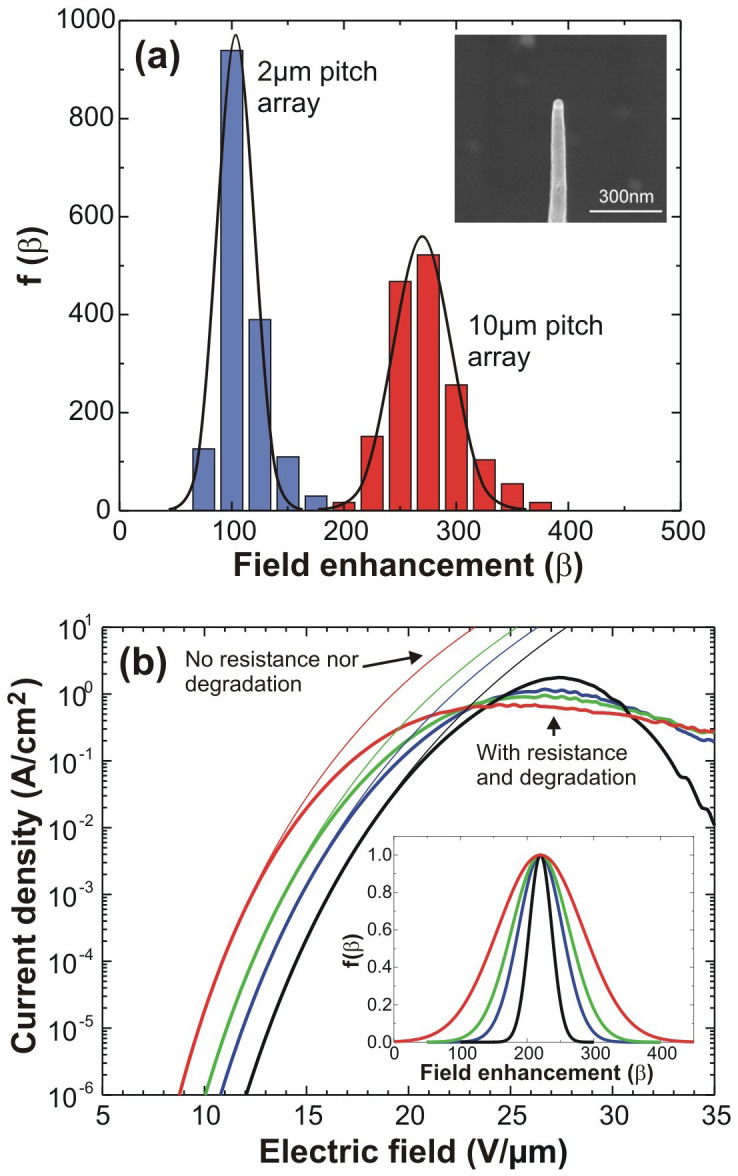
Figure 3.

(a) f(β) histograms and corresponding Gaussian fits, for CN arrays of 2 µm and 10 µm pitch. The field enhancement peak f(β) for the 2 µm CN has a center at βo = 104 and FWHM = 39, and the 10 µm; βo = 271 and FWHM = 61. The inset shows an electron micrograph of an individual CN (Scale bar: 300 nm). (b) Modeled current density as a function of applied electric field and increasingly broad f(β) (inset).
