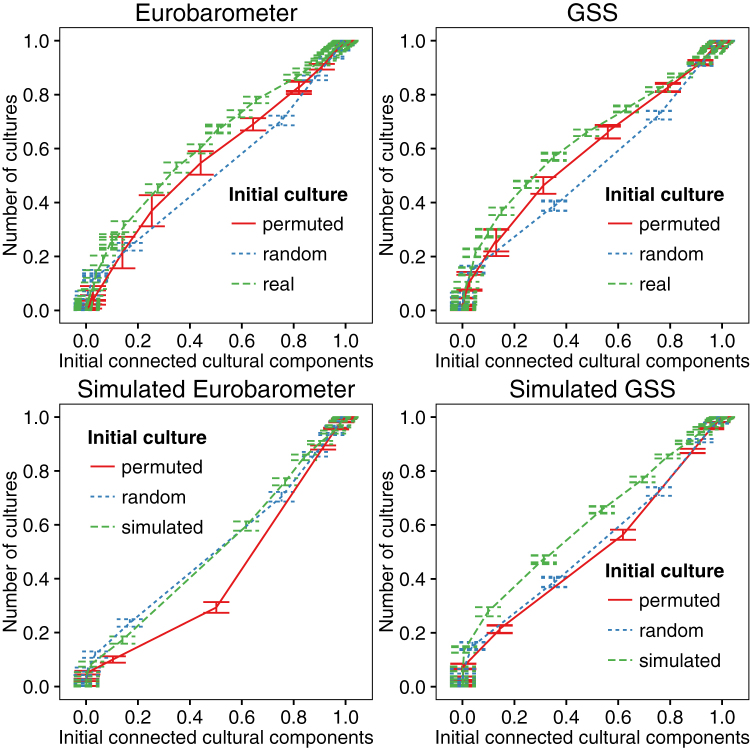
Figure 2. Number of cultures at the absorbing state (y axis) in the extended Axelrod model versus number of initial connected culture components (x axis) for Eurobarometer and GSS data (N = 600), both real and simulated using random values with the same covariance as the real data.
The value of θ is varied to obtain different numbers of initial connected components in the culture graphs along the x axis and the corresponding numbers of cultures (normalised to lie between 0 and 1 by dividing by N) at the absorbing state on the y axis.

