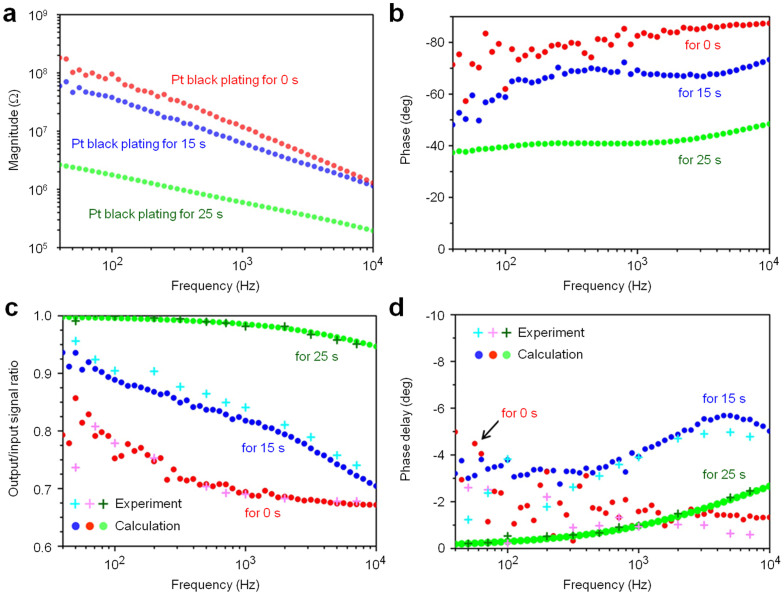
Figure 4. Electrical properties of microneedle electrodes measured in saline.
(a) Magnitude and (b) phase of electrical impedances of the microneedle electrodes acquired in a room temperature 0.9% NaCl saline solution bath at frequencies from 40 Hz to 10 kHz as functions of the Pt black-electroplating time. (c) Output/input signal amplitude ratios and (d) phase differences of these three needle electrodes taken from test signal recordings. Test signals of 80 μVp-p sinusoidal waves at 40 Hz to 7 kHz are applied to the solution bath. Red, blue, and green circles in (a–d) represent the original Pt tip (without Pt black electroplating), 15-s plated Pt black tip, and 25-s plated Pt black tip, respectively. For comparison, the bottom graphs (c, d) include both calculated (•) and experimental (+) data.

