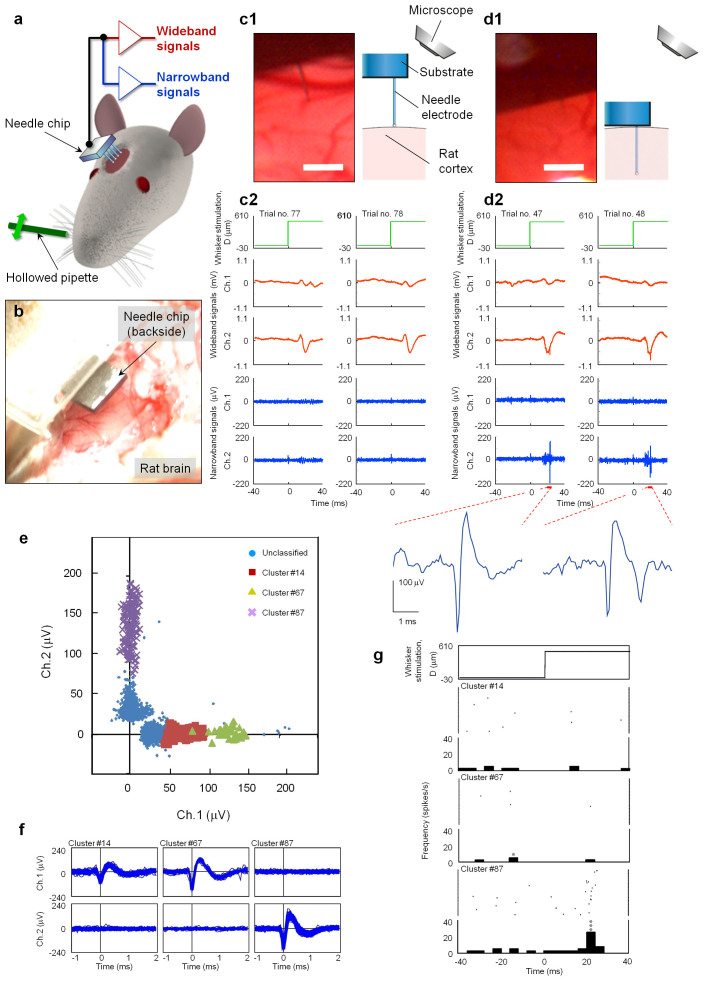
Figure 5. In vivo recording with a needle-electrode array.
(a) Schematic of the measurement system. Needle-electrode array penetrates the left whisker barrel area in the somatosensory cortex of a rat. Signals derived from the needle-electrode array are amplified (gain: 2,000) and filtered (bandpass: 15 Hz–10 kHz) to record wideband signals, which are further amplified (gain: 10) and filtered (bandpass: 500 Hz–10 kHz) to obtain narrowband signals. Rat's principal whisker (A1) of the barrel penetrated with a needle-electrode (Ch. 2) is mechanically stimulated with a hollow glass-pipette, and the whisker is deflected with a displacement of 500 μm [“D (μm)”]. Whisker is stimulated at 1 Hz for a 100-s recording period (i.e., 100 trials). (b) Photograph showing the placement of the needle-chip over the cortical surface. (c1, c2) Signals recorded before penetration. (c1) Photograph and schematic show the needle-tip in contact with the cortical surface. (c2) Wideband and narrowband signals derived from two channel needle-electrodes (Ch. 1, Ch. 2) for two successive trials. (d1, d2) Signals recorded after the needles penetrated 200 μm. Explanation of the panels (d1) and (d2) are the same as that in (c1, c2). Panel (d2) also includes enlarged waveforms of the narrowband signals at Ch.2 ~ 20 ms after whisker stimulation. Scale bars in (c1) and (d1): 200 μm. (e) Amplitude distribution of the spike-like waveforms simultaneously recorded at Ch. 1 and Ch. 2 after needle penetration. Spike-like waveforms are classified into three clusters: orange squares (cluster #14), yellow triangles (#67), and purple crosses (#87). (f) Superimposition of spike-like waveforms included in each cluster: #14 (the number of waveforms, n = 109), #67 (n = 34), and #87 (n = 136). (g) Rasters and peri-stimulus time histograms (PSTHs) of spike-like waveforms in the three different clusters. Uppermost graph shows displacement D of the principal whisker in the rostral direction. Other graphs show the rasters and PSTHs of clusters #14, #67, and #87 (Figs. 5e and 5f). Bin width: 4 ms. Asterisk denotes a significant spike; single: p < 0.05 and triple: p < 0.001 (one-sided binomial test assuming equiprobable spike occurrence between bins).

