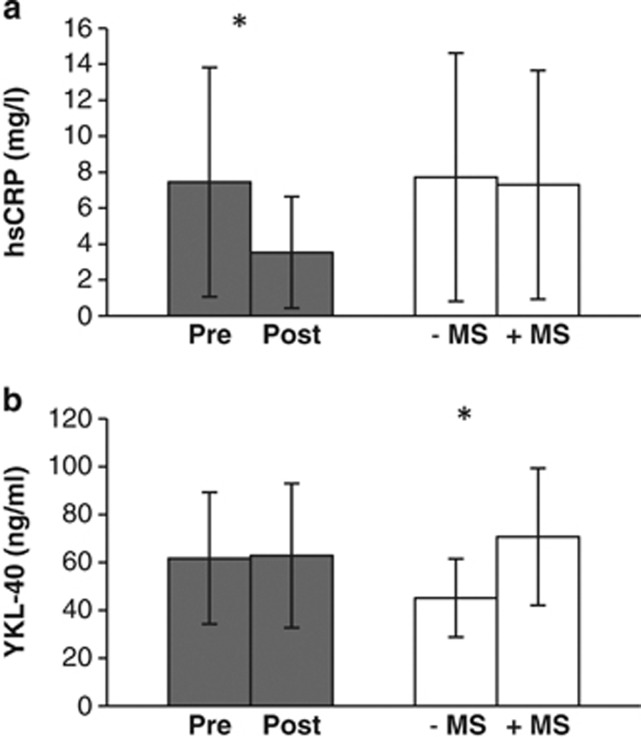
Figure 3.
The inflammatory biomarkers hsCRP and YKL-40. Levels of hsCRP and YKL-40 are expressed as means and error bars represent±s.d. Gray bars  show levels of hsCRP and YKL-40 at the preoperative baseline visit (Pre, n=20) and 3 months postoperatively (Post, n=20). White bars □ show baseline levels of hsCRP and YKL-40 in relation to the presence (+MS, n=13) or absence (−MS, n=7) of the metabolic syndrome. (a) *P=0.005. (b) *P=0.014. +MS, presence of the metabolic syndrome; −MS, absence of the metabolic syndrome.

