
Figure 3. mTBI induces free radical adducts in rat brain.
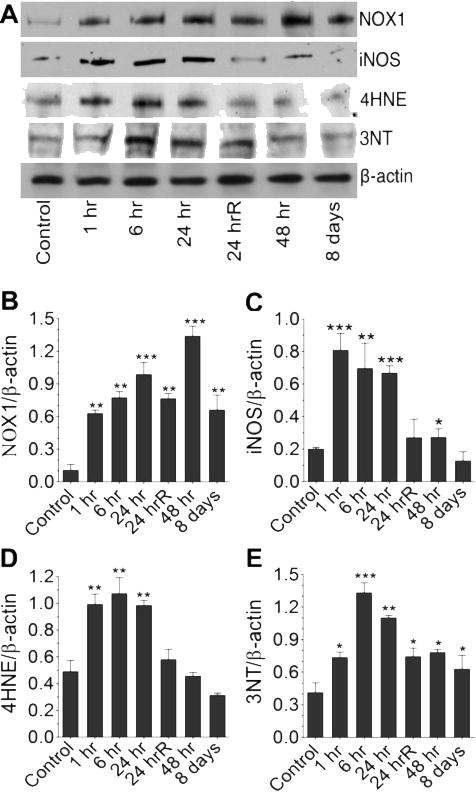
(A) Western blot analyses of NOX1, iNOS, 4HNE and 3NT in the whole rat brain homogenates at different time points after exposure to blast with 123 kPa peak. (B–E) Bar graphs show the results that are expressed as ratio of NOX1/iNOS/4HNE/3NT to that of β-actin band. Values are mean ±SEM (n = 4). *p<0.05; **p<0.01, ***p<0.001 versus control.