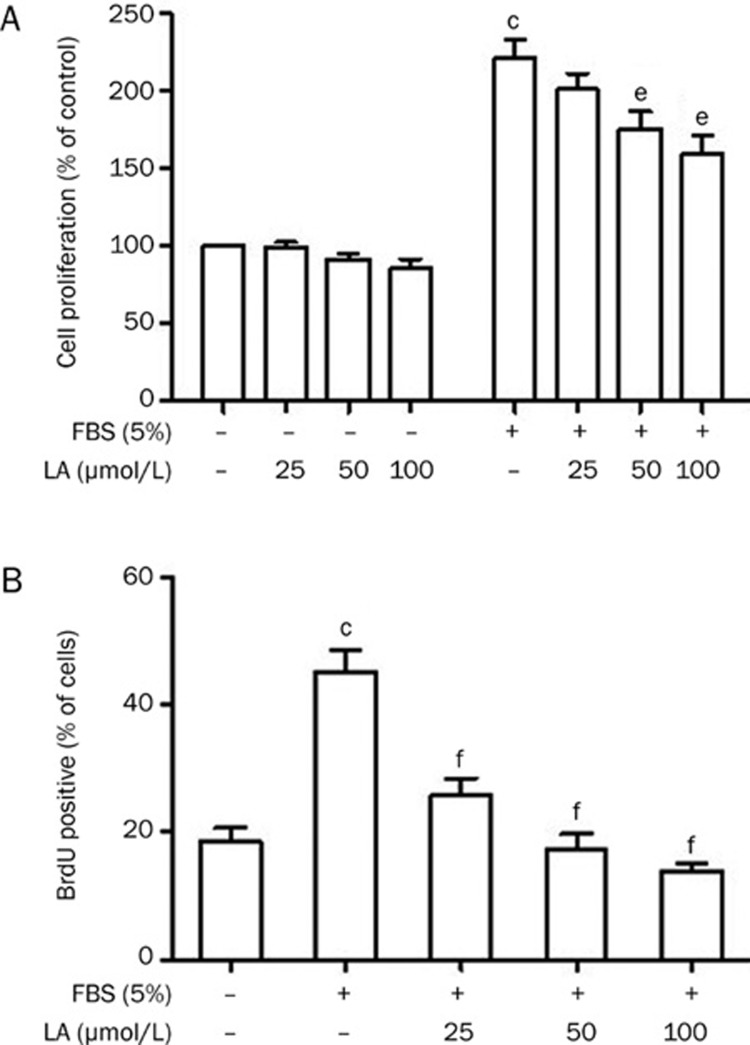
Figure 4.
Effects of LA on FBS-induced proliferation and DNA synthesis in VSMCs. (A) Proliferation activities were measured by MTT assay in the absence (left) or presence (right) of 5% FBS. Relative proliferation activities were expressed using untreated control cells as a standard. n=6. (B) DNA synthesis was measured by BrdU incorporation assay. The left part of the diagram shows BrdU incorporation of quiescent and FBS-stimulated VSMCs. On the right side, a concentration-dependent decrease of BrdU incorporation in LA-treated VSMCs is shown. n=6. Values are presented as mean±SEM. cP<0.01 vs control. eP<0.05, fP<0.01 vs FBS.

