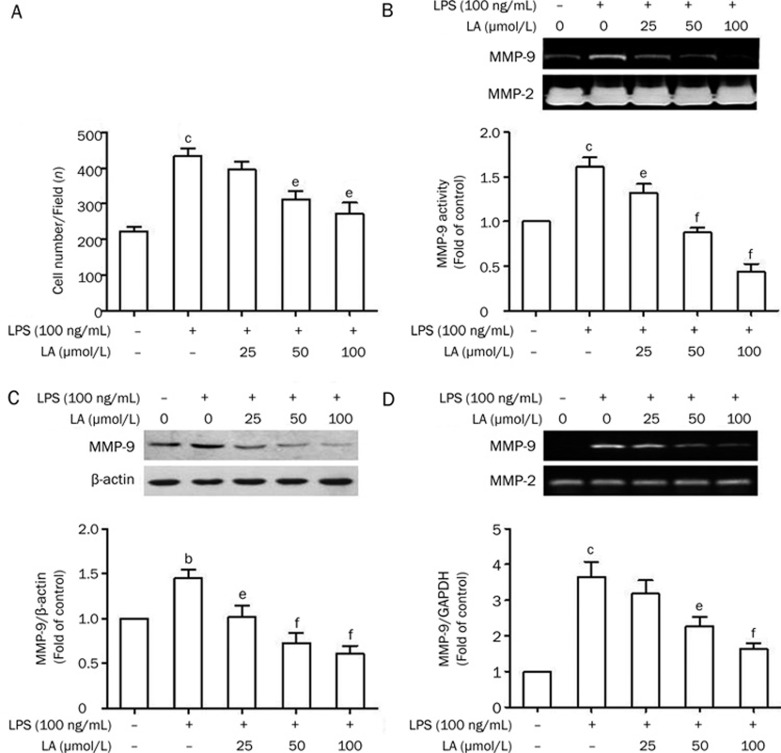
Figure 7.
Effects of LA on LPS-induced VSMC migration as well as MMP-9 enzymatic activity and expression. (A) Cells were treated as indicated and migration assays were performed as described in the Methods section. The diagram shows counted cells on the bottom side of the transwell chamber membrane at different LA con-centrations. n=6. Cells were pretreated with LA for 2 h prior to 100 ng/mL LPS stimulation for 24 h. (B) The conditioned media were prepared and used for gelatin zymography. n=6. (C) The total cellular proteins were prepared and used for Western blotting. n=3. (D) The MMP-9 mRNA levels were measured by RT-PCR. GAPDH was used as an internal control. n=6. Values are presented as mean±SEM. bP<0.05, cP<0.01 vs control. eP<0.05, fP<0.01 vs LPS.

