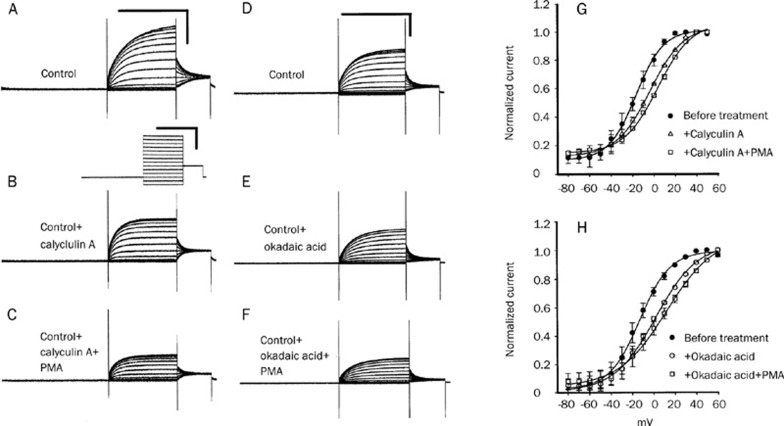
Figure 4.
Effects of phosphatase inhibitors (calyculin A and okadaic acid) and the combination of phosphatase inhibitor with PMA on the KCNQ4 currents. Typical recording traces of KCNQ4 are shown in figures (A)(F). The traces in Figures (A)–(C) and Figures (D)–(F) are recorded from the same oocyte, respectively. Tail current amplitudes of control KCNQ4 (A) were significantly inhibited by the addition of 2 μmol/L calyculin A (B) and, subsequently, addition of PMA (2 mol/L) caused a further decrease in the current amplitudes (C). The effect of okadaic acid (1 μmol/L) on the KCNQ4 current amplitudes was similar to that of calyculin A (D: before the treatment with okadaic acid; E: after the treatment with okadaic acid; F: okadaic acid plus 2 mol/L PMA). All static values of current amplitudes are shown in the results section. Calibration scales of all current traces are shown in the upper right corners of (A) and (D): 2 s and 2 μA. The voltage-step protocol is shown below (A). Figures (G) and (H) show conductance-voltage (G–V) curves of KCNQ4. Both calyculin A and okadaic acid can produce a positive shift of the half voltage of the GV curve (•: before the treatment in Figs G and H; △: after treatment with calyculin A in Figure G; ○: after treatment with okadaic acid in Figure H). Subsequently, the further addition of PMA after the phosphatase inhibitor can produce a more positive shift of V1/2 (□: calyculin A plus PMA and okadaic acid plus PMA in Figures G and H, respectively).

