Figure 4.
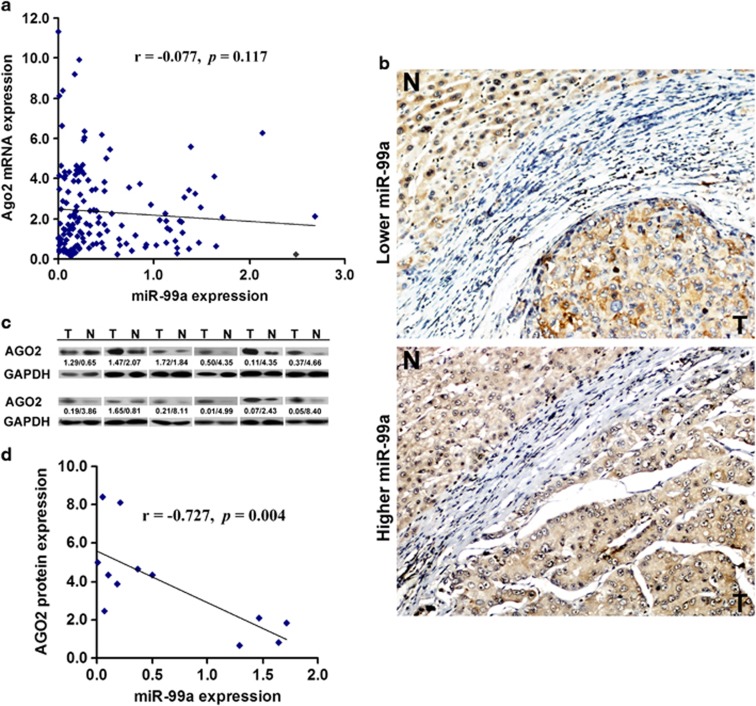
Ago2 is upregulated in HCC and negatively correlated with miR-99a. (a) The correlation between relative expression of miR-99a and Ago2 mRNA in HCC tissues as determined by qRT–PCR. (b) Increased AGO2 protein as analyzed by immunohistochemistry in cancerous tissues. The patient serial number was 30 and 6, respectively. (c) Increased AGO2 protein as detected by western blotting. Expression ratio was calculated by normalizing AGO2 to total protein levels in each case. The value of relative expression of miR-99a/AGO2 protein is shown below. The patient serial number was 6, 8, 9, 11, 30, 41, 53, 68, 73, 90, 121, and 132, respectively. N, matched noncancerous control; T, HCC tissue. (d) The correlation between expression of miR-99a and AGO2 protein in 12 pairs of HCC samples mentioned above.

